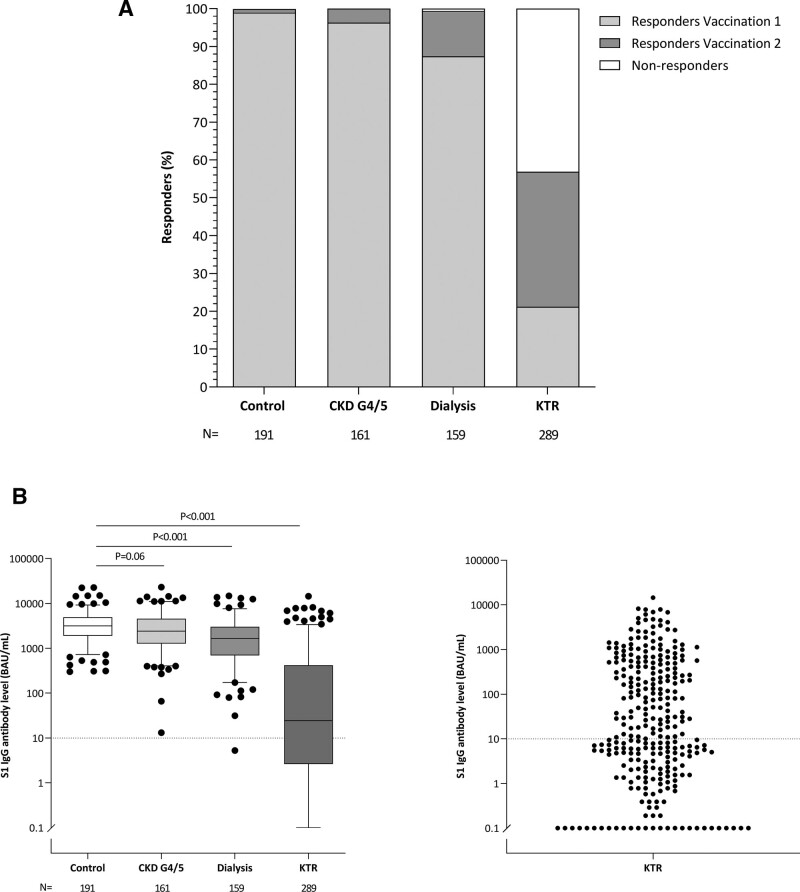
FIGURE 2.
Proportion of responders (A) and SARS-CoV-2 Spike S1-specific IgG antibody levels (B) per study cohort at 28 d after second vaccination. A, Responders were defined as subjects with a S1-specific IgG antibody level ≥10 BAU/mL after first vaccination or second vaccination. B (left panel), Depicted are box and whisker plots together with outliers, with the box representing median and interquartile range, whiskers representing the 95% CI; (right panel) dot plot of S1-specific IgG antibody level of kidney transplant recipients only. Dotted horizontal line indicates threshold for definition of responder at ≥10 BAU/; P were calculated using Mann-Whitney U test and corrected for multiple testing by Bonferroni. BAU, binding antibody unit; CKD, chronic kidney disease; IgG, immunoglobulin G; KTR, kidney transplant recipient; N, number; SARS-CoV-2, severe acute respiratory syndrome coronavirus 2.

