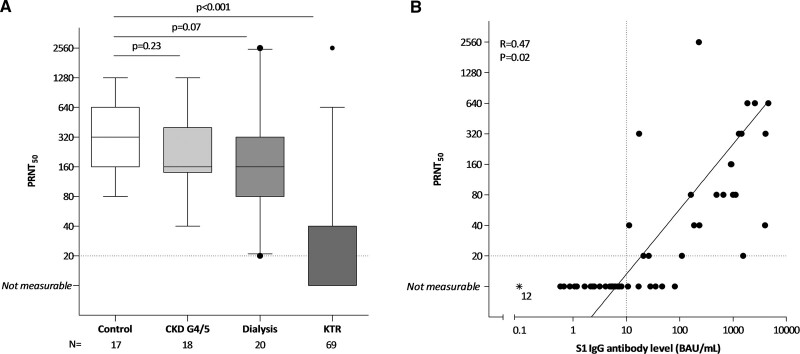
FIGURE 3.
SARS-CoV-2 neutralizing antibody titer (PRNT50). A, Data of a random subset of subjects included in 1 of the participating centers. Data are shown as box and whisker plots together with outliers, with the box representing median and interquartile range, whiskers representing the 95% confidence interval. P were calculated using Mann-Whitney U. B, S1 specific IgG antibody levels for all kidney transplant recipients included at that center (N = 69) and correlation with PRNT50. Dotted vertical line indicates threshold for seroresponse, and horizontal line indicates the threshold for neutralizing capacity. Asterisks represent samples assumed not measurable. The solid line represents the regression line calculated for only subjects with seroconversion (S1-specific IgG response ≥10 BAU/mL) and a measurable T-cell response (PRNT50 ≥20), with corresponding R and P calculated using Spearman correlation. CKD, chronic kidney disease; IgG, immunoglobulin G; KTR, kidney transplant recipient; N, number; PRNT50, 50% plaque reduction neutralization test; SARS-CoV-2, severe acute respiratory syndrome coronavirus 2.

