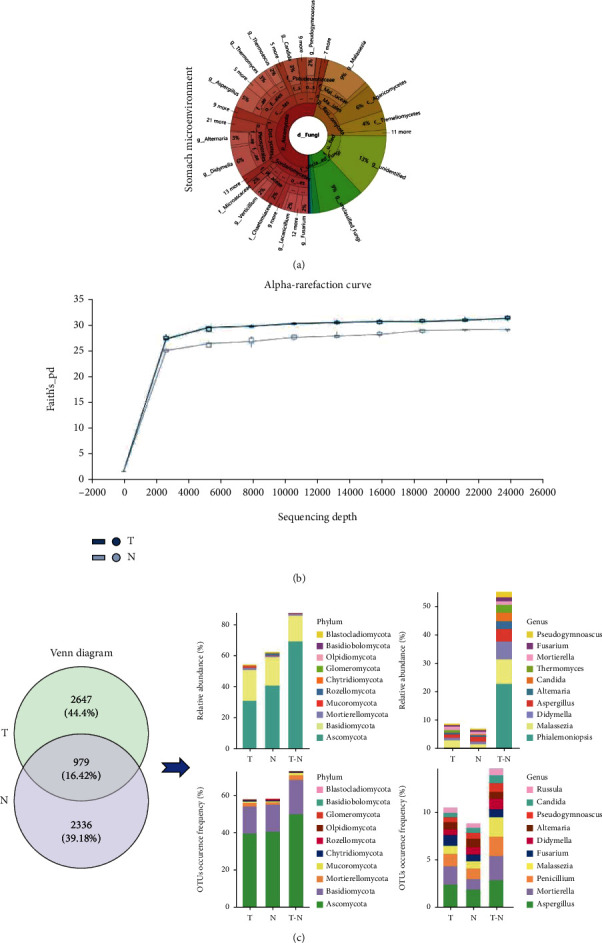
Figure 1.

Alteration of gastric mucosal fungal microbiota between the tumor and normal group. (a) Krona pie charts were established to indicate the distribution of gastric mucosal fungal microbiomes in the stomach microenvironment; (b) alpha rarefaction curves were used to estimate the species richness of the fungal microbiota between the two groups; (c) the Venn diagram illustrated the overlapping gastric mucosal fungal microbiota between the two groups, and the distribution and abundance of overlapping fungi was evaluated based on the sequence information of the OTUs at the phylum and genus level.
