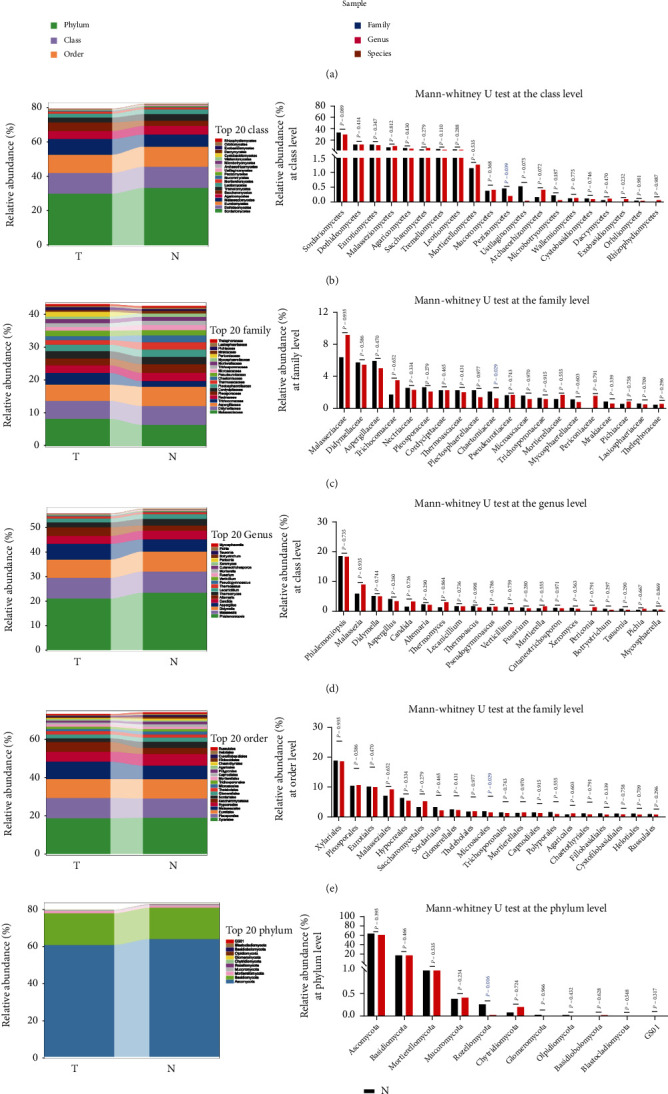
Figure 2.

Differential taxa composition between the tumor and normal group in GC. (a) The fungal composition in primary tumor and corresponding paired normal mucosal tissues from 61 GC patients was displayed at different classification levels, including the phylum, class, order, family, genus, and species levels; (b–f) the abundance and distribution of the top 20 fungal taxa were described between the two groups at the class, family, genus, order, and phylum levels and were analyzed by the Mann–Whitney U test.
