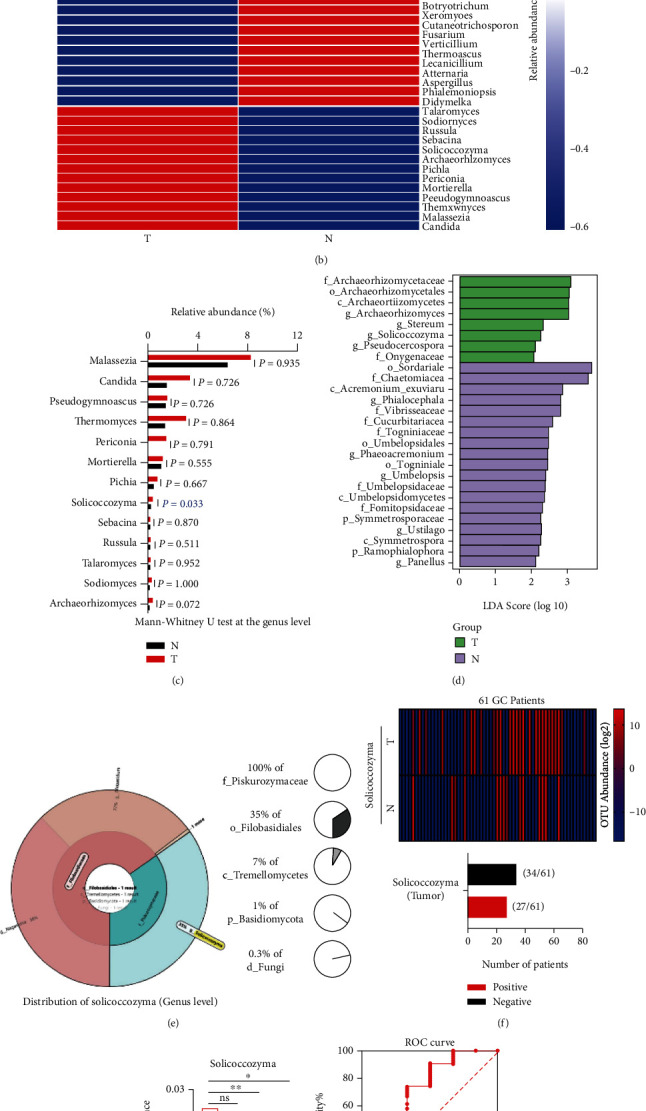
Figure 3.

Fungal microbiome profiling revealed the role of Solicoccozyma in the GC microenvironment. (a) A heatmap described the average abundance of the top 50 gastric fungi at the genus level; (b) a cluster heatmap indicated the differentially enriched gastric fungal microbiomes between the two groups; (c) the 13 fungal microbiotas that had higher abundances and were differentially enriched in the tumor group by comparison to the normal group based on the Mann–Whitney U test; (d) LEfSe identified the taxa with the greatest differences in abundance between the tumor and normal group, the taxa with a significant LDA threshold value of >2 and P value < 0.05 are shown (p: phylum, c: class, o: order, f: family, g: genus, s: species); (e) the distribution of Solicoccozyma account for a percentage of gastric fungi in the GC microenvironment; (f) a cluster heatmap showed the abundance of Solicoccozyma in the primary tumor and corresponding paired normal tissues from 61 GC patients, and GC patients with positive Solicoccozyma expression in tumor was described; (g) the abundance of Solicoccozyma in GC patients with stages I, II, III, and IV; (h) the ROC curves of Solicoccozyma provided an area under the receiver-operating characteristic curve (AUC) for the classification of the stage I and stage II-IV GC patients; (i) the abundance of Solicoccozyma in GC patients with nerve invasion and nonnerve invasion; (j) the AUC value of Solicoccozyma for the classification of the nerve invasive and nonnerve invasive GC patients.
