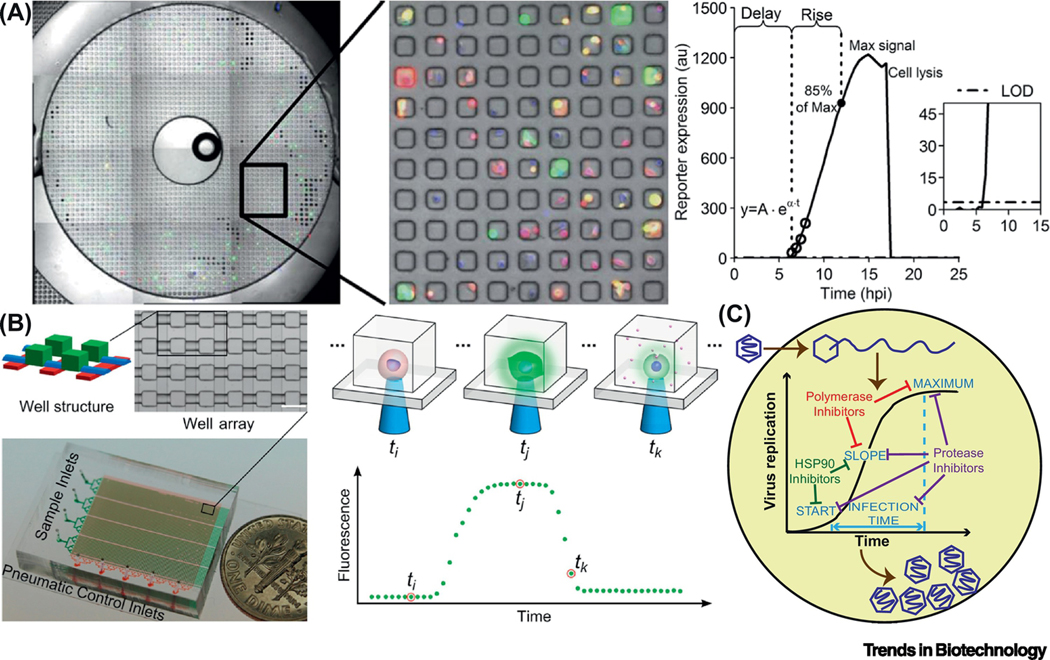
Figure 2.
Microfluidic platforms for kinetic analysis of viral infection dynamics in single cells. (A) One of ten bull’s-eyes on a PDMS microwell device, each containing 2,500 sub-nanoliter volume wells. VSV infected PC3 cells were loaded into the microwell array. They were engineered so that RFP and GFP signals indicated the production of infectious virus particles and the activation of cellular innate immunity, respectively. A model was used to process the fluorescent trajectories from each single cell and derive kinetic parameters. Delay-time: the first data point above the limit of detection (LOD); maximum signal: the highest intensity reached; rise-time: the period between the delay-time and the time when 85% of the maximum signal was reached; production-rate: speed of the production, obtained by fitting the first four data-points above the LOD with an exponential curve. Adapted with permission from [34]. (B) A device composed of 4 groups of 1,600 microchambers for single-cell cultivation, which could be sealed with pneumatic valves. A complete time course of infection by a virus expressing a fluorescent reporter could be recorded. Adapted with permission from [35]. (C) Single-cell analysis of viral infection dynamics could inform mechanism of actions of antiviral drugs [39].

