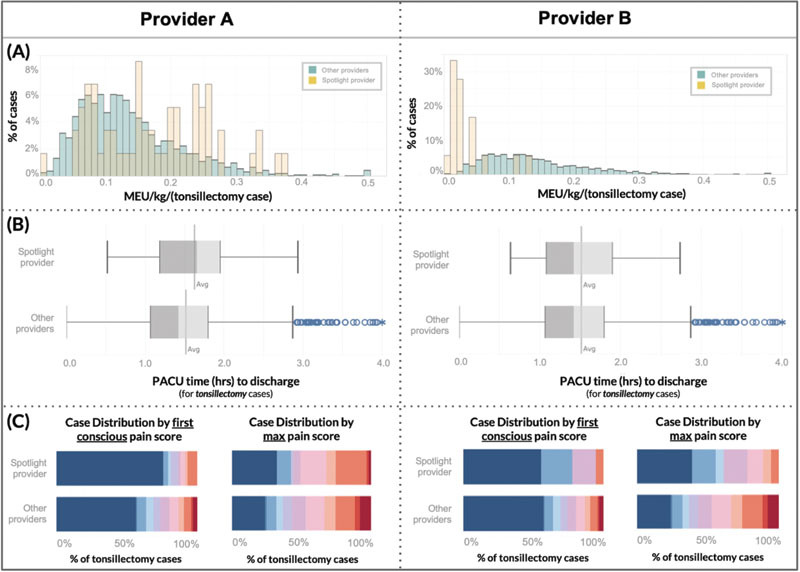
Fig. 3.

In the Provider Tab, we implement case-mix adjustment via interactive data filtration by any combination of anesthesiologist, primary procedure, service, date, and regional anesthesia. This mechanism allows clinically meaningful comparisons of individual providers to their peers: ( A ) Histograms compare spotlighted provider ( yellow ) to peers' ( green ) morphine equivalent units (MEU) per kilogram for tonsillectomy cases (includes both intraoperative and PACU opioid received); ( B ) Box and whisker plots compare tonsillectomy post anesthesia recovery unit (PACU) discharge time for spotlighted provider's patients ( above ) to peers' patients ; ( C ) Heat maps ( blue = 0/10 pain, red = 10/10 pain) compare PACU first conscious and max tonsillectomy pain scores of spotlighted provider's patients (above) to their peers' patients. MEU, oral morphine equivalent units; kg, kilogram; PACU, post anesthesia care unit; h, hours.
