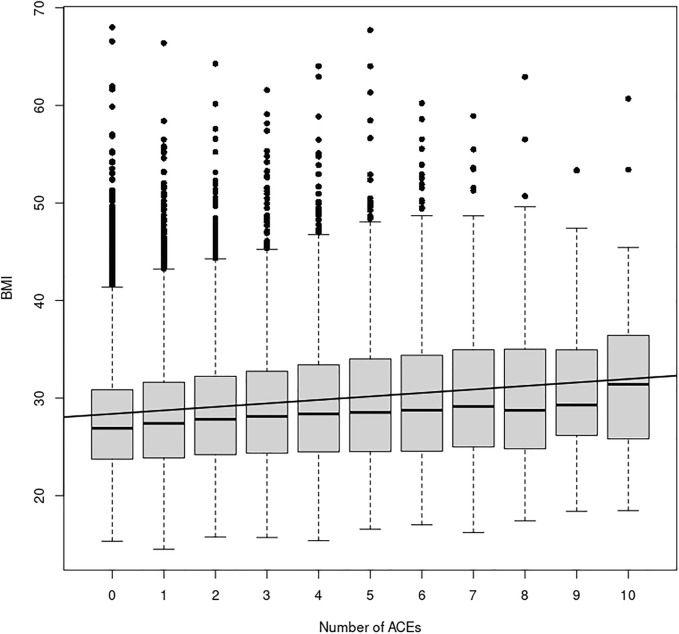
FIGURE 1.
ACE Relationship vs. BMI. This figure shows the relationship between the number of ACEs experienced and average BMI in each ACEs group, irrespective of age, sex, or ethnicity. The black line depicts the simple linear regression with slope 0.36 (p << 2 × 10⁻¹⁶) and y-intercept 28.03. Additionally, a simply one-way ANOVA shows a statistically significant difference in the BMI index between the ACE groups (p < 2 × 10⁻¹⁶).

