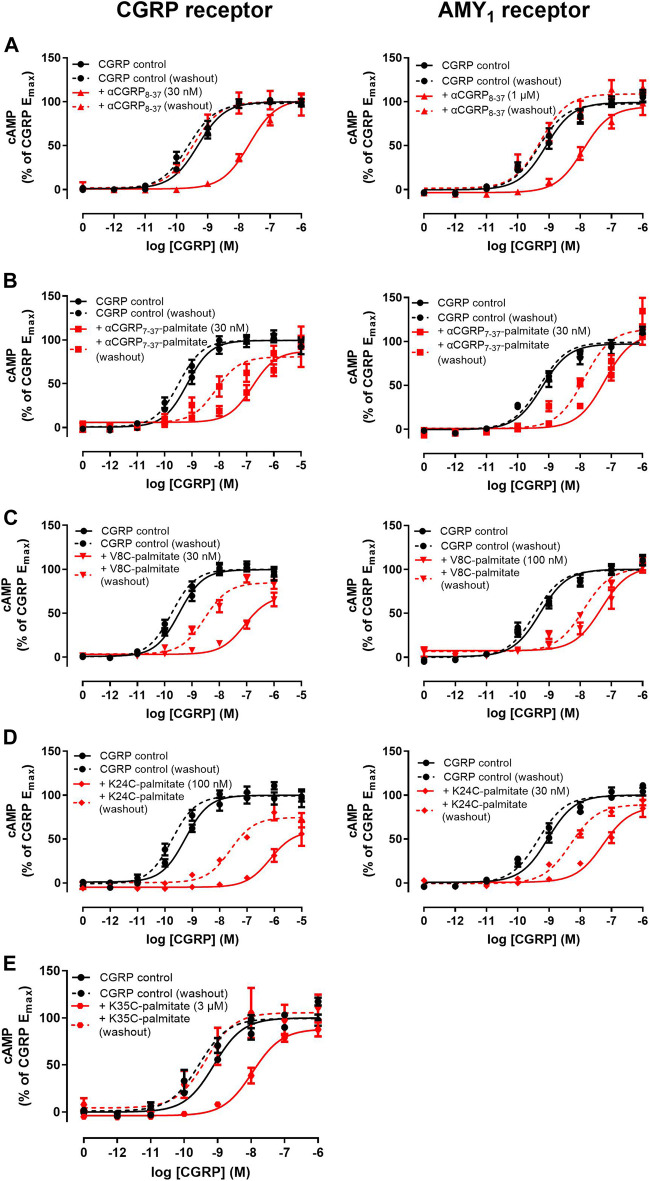
FIGURE 5.
Effect of antagonist with pre-incubation and a washout step on agonist concentration-response curves at human CGRP and AMY1 receptors expressed in Cos-7 cells. (A) αCGRP8-37, (B) αCGRP7-37-palmitate, (C) V8C-palmitate, (D) K24C-palmitate, (E) K35C-palmitate. Solid and dashed lines indicate agonist concentration-response curves performed in the absence or presence of a washout step prior to agonist stimulation. Data points are plotted as a percentage of maximal CGRP-stimulated cAMP production and show mean ± SEM of five independent experiments.

