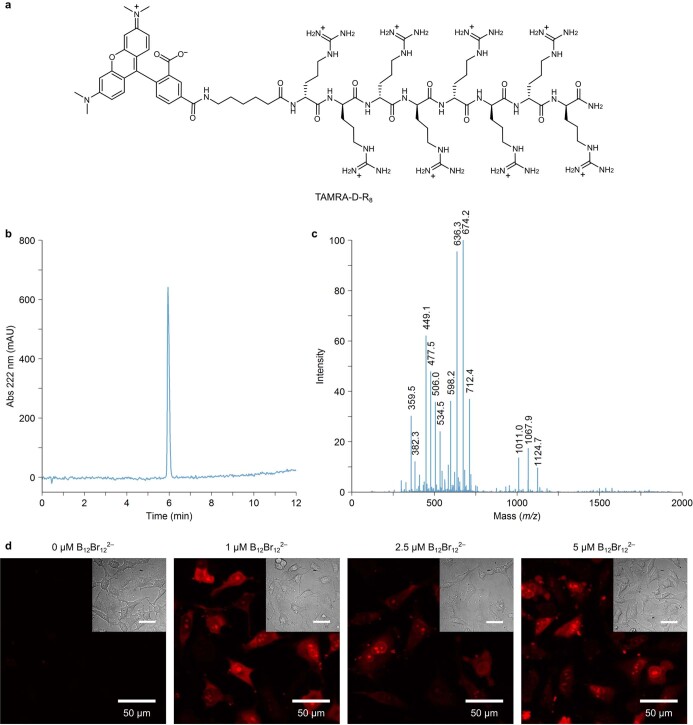
Extended Data Fig. 6. Characterization of the TAMRA-D-R8 enantiomeric peptide and its cellular uptake.
a, TAMRA-D-R8 structure. b, RP-HPLC [Agilent SB-C18 column, H2O (0.1% TFA)/CH3CN (0.1% TFA) 95:5→5:95 (0→12 min)], Rt: 5.96 min. c, ESI-MS of TAMRA-D-R8. d, Fluorescence images of HeLa cells obtained after incubation with 1 µM of TAMRA-D-R8 and the indicated concentrations of B12Br122− for 30 min and washing; bright-field images in insets; all scale bars are 50 µm; the second panel (1 µM) is also shown in Fig. 3 in main text. Representative images of two biological replicates. Note that the clusters did not affect uptake of the non-conjugated TAMRA probe (see Supplementary Note 3).

