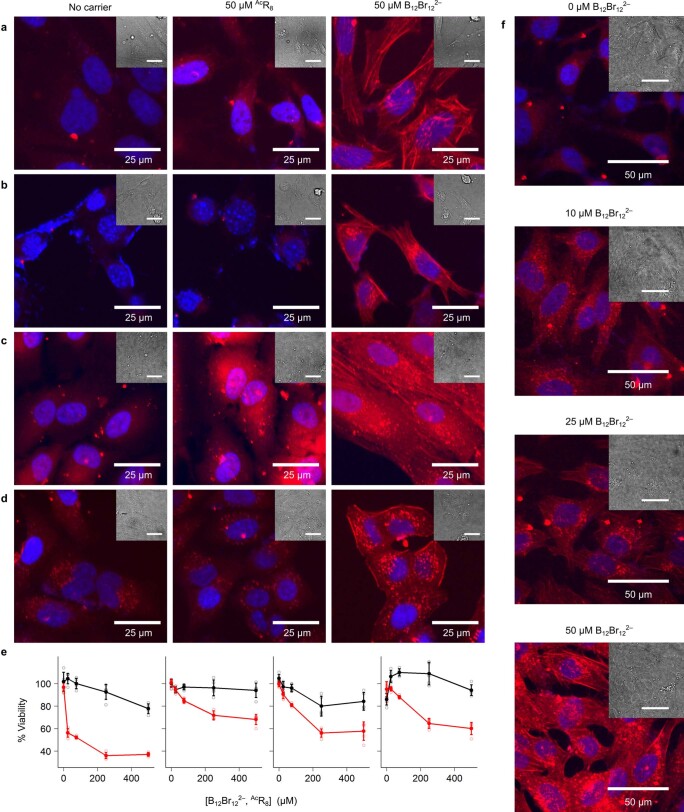
Extended Data Fig. 7. B12Br122−-assisted phalloidin-TRITC transport into living cells.
a, HeLa, b, GT1-7, c, ARPE-19 and d, A549. Cells were incubated with 7 µM phalloidin-TRITC (red) in the absence (left) and presence of 50 µM AcR8 (middle) or 50 µM of B12Br122− cluster (right) in HKR buffer for 3 h, subsequently stained with Hoechst (blue), washed with DMEM without phenol red, and imaged by confocal fluorescence microscopy; bright-field images in insets. Micrographs from each cell line were processed independently, experiments were performed twice. e, MTT viability assay of the corresponding cell lines (HeLa, GT1-7, ARPE-19 and A549, from left to right) at different concentrations (0, 25, 75, 250, and 500 µM) of B12Br122− (black) or AcR8 (red); data are mean ± s.d. of five measurements. f, Confocal images of HeLa cells after incubation with 500 nM phalloidin-TRITC and different concentrations B12Br122−; the images correspond to those of Fig. 4 in the main text, but are shown with increased brightness to facilitate observation of the actin filaments. Representative images of two biological replicates. All scale bars are 25 µM, except for panel f (50 µm).

