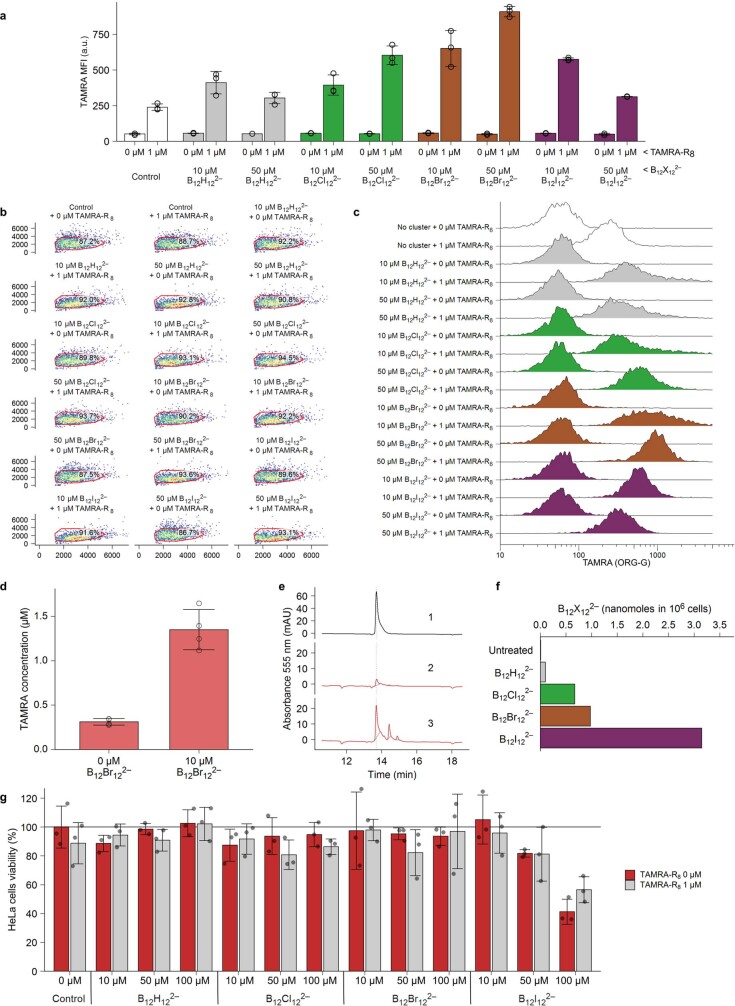
Extended Data Fig. 5. Cluster-mediated TAMRA-R8 cellular uptake, cellular cluster uptake and cluster toxicity.
a, HeLa cells were incubated with 0 or 1 µM TAMRA-R8 and 10 or 50 µM of each cluster for 1 h and subsequently washed and trypsinized for flow cytometry analysis. Data are mean ± s.d. of the median fluorescence intensity of three replicates. b, Gating strategy for one of the replicates (axes: x = FSC, y = SSC). c, Normalized histograms showing TAMRA fluorescence in the gated population for one of the replicates. d, Cytosolic concentration of TAMRA-R8 in HeLa cells as calculated from extracts obtained after incubation with digitonin. Cells were incubated with 1 µM peptide, in the absence or presence of 10 µM cluster for 1 h. Cytosolic concentrations were calculated from the number of cells per well assuming a HeLa cell volume of 5 pL; the resulting cytosolic concentration in the presence of the cluster (1.35 ± 0.23 µM) was 4.4 times higher than the one obtained after incubation with the peptide alone (0.31 ± 0.04 µM). Background luminescence levels in the absence of the fluorescent peptide corresponded to apparent concentrations of less than 0.02 µM. Data are mean ± s.d. of four independent experiments, each with three technical replicates. e, HPLC analysis of TAMRA-R8 obtained after incubation with digitonin: pure peptide reference (1), HeLa cells incubated with 1 µM peptide (2), and HeLa cells incubated with 1 µM peptide and 10 µM cluster (3). Peak integration (as defined by the grey line) showed a ca. 5 times higher level of intact peptide in the presence of the cluster. f, Cellular uptake of boron clusters as determined through the content of atomic boron by ICP-MS. HeLa cells were lysed after 3 h incubation with 50 µM of each cluster diluted in HKR. g, Viability of HeLa cells incubated with the indicated clusters diluted in DMEM in the absence (red) or presence (grey) of 1 µM TAMRA-R8 for 1 h, washed and further incubated with complete medium containing 0.5 mg/mL of MTT. After medium removal and solubilization with DMSO, the absorbance at 570 nm was measured. Values were normalized to the untreated cell control (100%). Data are mean ± s.d. of three replicates.

