
Extended Data Fig. 5. Quantification of viral RNA.
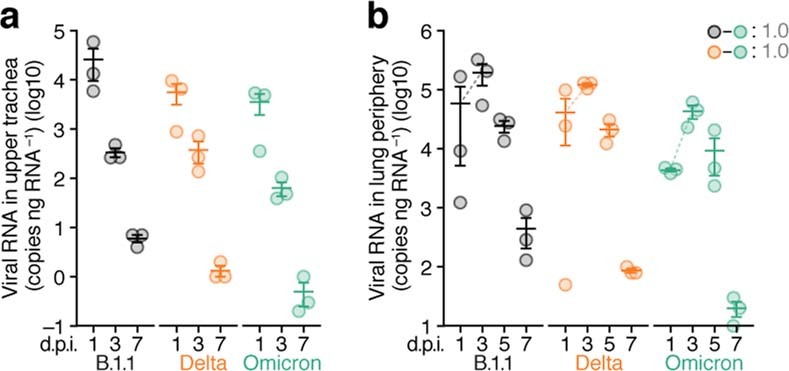
Syrian hamsters were intranasally inoculated with B.1.1 (n = 3), Delta (n = 3) and Omicron (n = 3). Viral RNA levels in the upper trachea (a) and lung periphery (b) were quantified by RT–qPCR. Data are mean ± s.e.m., and each dot indicates the result from an individual hamster. In b, the broken lines indicate the slopes of the average values between 1 d.p.i. and 3 d.p.i. Statistically significant differences of the slopes were determined by a likelihood-ratio test comparing the models with or without the interaction term of time point and inoculum. FWERs calculated using the Holm method are indicated in the figures.