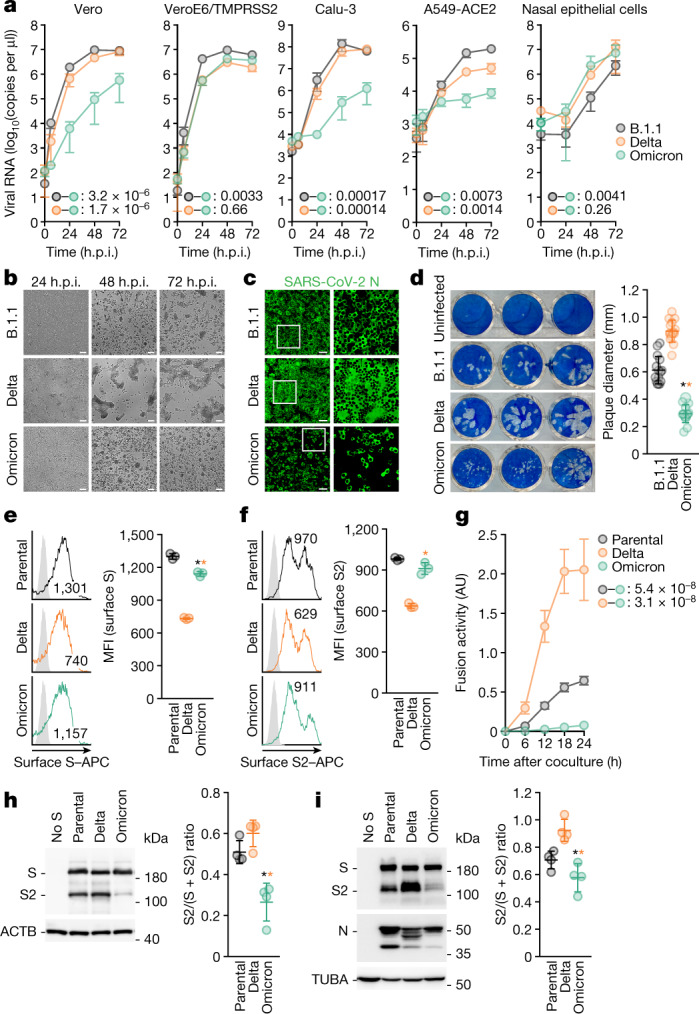
Fig. 2. Virological features of Omicron in vitro.

a, Growth kinetics of Omicron. B.1.1 virus, Delta and Omicron were inoculated into cells, and the copy number of the viral RNA in the supernatant was quantified by quantitative PCR with reverse transcription (RT–qPCR). b, Bright-field images of infected VeroE6/TMPRSS2 cells (multiplicity of infection (m.o.i.) of 0.01). c, Immunofluorescence staining. Infected VeroE6/TMPRSS2 cells (m.o.i. = 0.01) at 24 h.p.i. were stained with anti-SARS-CoV-2 N antibody. Higher-magnification views of the regions indicated by squares are shown on the right. Scale bars, 100 μm (b, c). d, Plaque assay. Left, representative figures. Right, summary of the diameter of plaques (15 plaques per virus). e, f, Expression of the S protein on the cell surface. Left, representative histogram stained with anti-S1/S2 polyclonal antibody (e) or anti-S2 monoclonal antibody (f). The number in the histogram indicates the mean fluorescence intensity (MFI). Grey histograms indicate isotype controls. Right, summary of the surface S MFI. g, SARS-CoV-2 S-based fusion assay. The fusion activity was measured as described in the Methods, and fusion activity (arbitrary units; AU) is shown. h, i, Left, representative western blots of S-expressing cells (h) or SARS-CoV-2-infected VeroE6/TMPRSS2 cells (m.o.i. = 0.01) at 48 h.p.i. (i). ACTB (h) or TUBA (i) are internal controls. Right, the ratio of S2 to the full-length S plus S2 proteins. Data are mean ± s.d. (a, d–i). Assays were performed in quadruplicate (a, g–i) or triplicate (e–f). Each dot indicates the result from an individual plaque (d) and an individual replicate (e, f, h, i). Statistically significant differences versus B.1.1 and Delta through time points were determined by multiple regression (a, g). Familywise error rates (FWERs) calculated using the Holm method are indicated. Statistically significant differences (*P < 0.05) versus B.1.1 and Delta were determined by two-sided Mann–Whitney U-test (d) or by two-sided paired Student’s t-test (e, f, h, i) without adjustment for multiple comparisons.
