
Fig. 2. Detection of endogenous W>F substitutants.
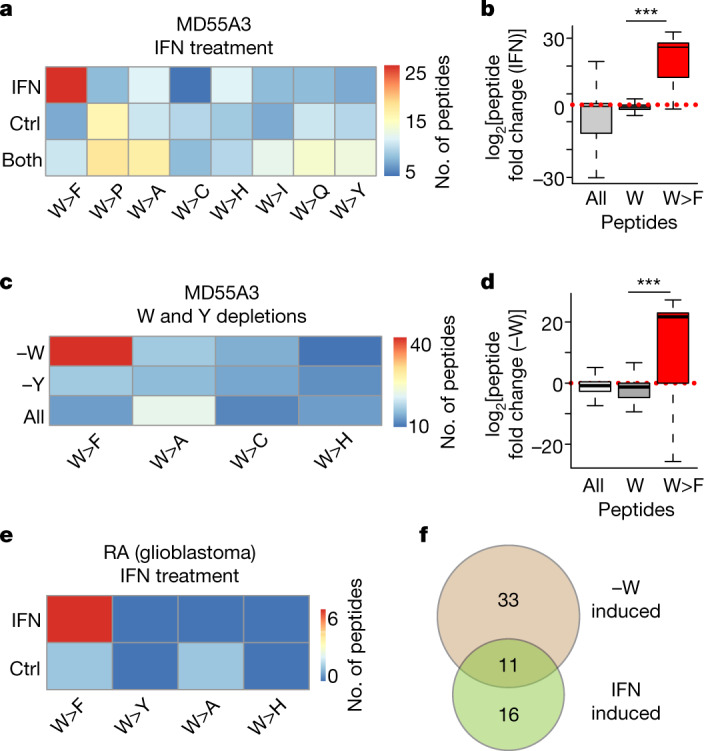
a, Heat map depicting the number of tryptophan (W) codon reassignments detected specifically in mock-treated (Ctrl) MD55A3 V5–ATF41–63–tGFP+1-expressing cells, in IFNγ-treated (IFN) cells, or in both. Only the peptides detected in two biological replicates (n = 2) of every condition were selected. b, Box plot depicting log2 fold change in peptide intensities between control and IFNγ-treated condition for all peptides in the proteome (whiskers show range without outliers, boxes encompass first and third quartiles and the centre line indicates the median). The groups are either all peptides detected in the proteome (all), or peptides that span tryptophan codons and contain a tryptophan (W) or W>F, respectively. ***P < 0.001, Wilcoxon test (unpaired two-sample t-test). c, Same as a, but for mock-treated, tryptophan-depleted (−W) or tyrosine-depleted (−Y) MD55A3 V5–ATF41–63–tGFP+1-expressing cells (n = 2 biological replicates). d, Same as b, but for log2 fold change in peptide intensities between control and tryptophan-depleted conditions. e, Heat map depicting the number of the indicated codon reassignment events at tryptophan codons, specifically detected in the proteomes of IFNγ-treated or control glioblastoma RA cells18 (n = 2 biological replicates). f, Venn diagram depicting the overlap between the W>F peptides detected in IFNγ-treated (IFN induced) or tryptophan-depleted (−W induced) MD55A3 cells.