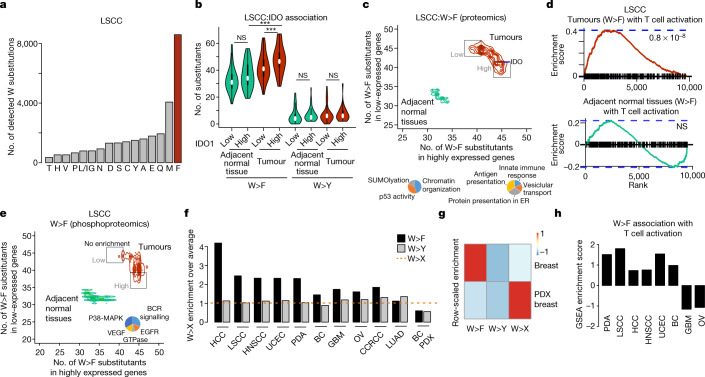
Fig. 3. Detection of W>F substitutants in cancer proteomes.
a, Bar plot depicting cumulative number of tryptophan substitutants detected in the proteomes of LSCC tumour and adjacent normal tissue samples. b, Violin plots depicting the number of W>F and W>Y events detected in IDO1 low (intensity < 0) and high (intensity > 0) in LSCC and adjacent normal tissue. Wilcoxon unpaired two-sample t-test; ***P = 0.008892 for within-tumour comparison, P < 2.2 × 10⁻¹⁶ for normal–tumour comparison. c, Top, scatter contour plot depicting the number of W>F substitutants per gene when the gene is expressed at a higher (intensity > 0, x-axis) or lower (intensity < 0, y-axis) level than in surrounding normal tissue. W>F substitutants in tumours (in red) and normal adjacent normal tissues (in green). Bottom left, pie chart depicting gene ontologies enriched for genes that are expressed at higher level when the number of W>F substitutants is lower in tumour samples. Bottom right, pie chart depicting gene ontologies enriched for genes that are expressed at higher level when the number of W>F substitutants is higher in tumour samples. ER, endoplasmic reticulum. d, GSEA plot depicting the enrichment of T cell activation signature stratified against the difference in the number of substitutants in the W>F high class versus the W>F low class. P-values by GSEA statistical comparison of ranked distribution against random distribution. e, Same as c, but for intensities of phosphorylation levels in phosphoproteomics datasets of LSCC and adjacent normal tissues. f, Bar plots depicting enrichment of W>F (black) and W>Y (grey) substitutants over the average of all tryptophan substitutants (W>X) in multiple human tumour types. g, Row-scaled enrichment heat map for W>F, W>Y and W>X (average) substitutants for primary breast cancer samples xenografts in mouse. h, Bar plots depicting GSEA enrichment scores for T cell activation signature stratified against difference in the number of substitutants in W>F high class versus the W>F low class.

