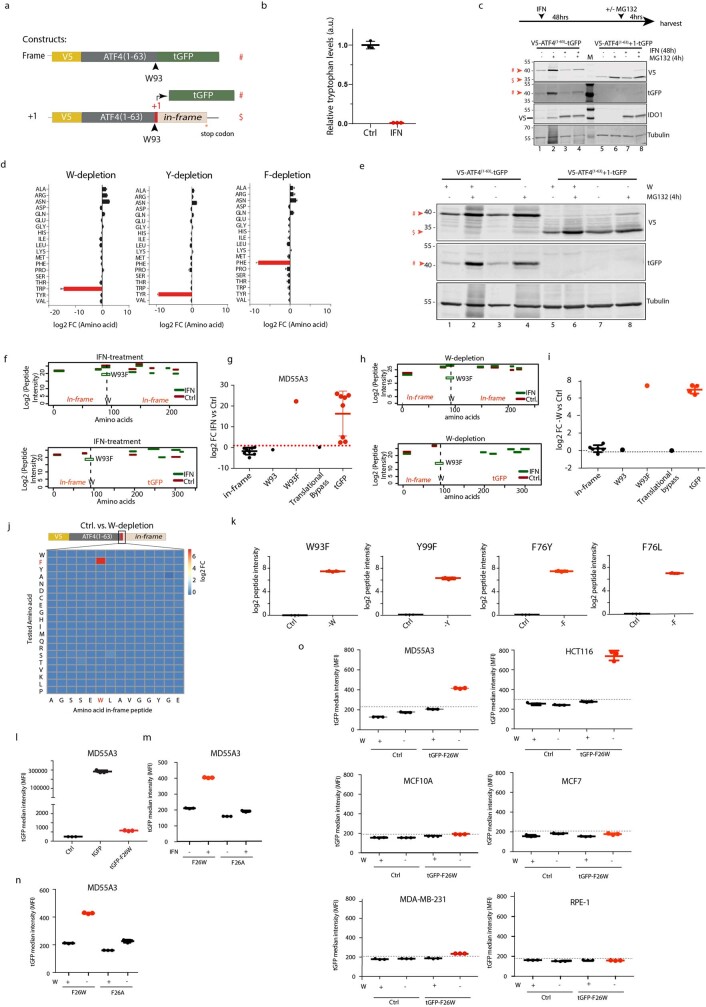
Extended Data Fig. 1. Reporter assays identify IFNγ-induced W>F codon reassignment.
(a) A scheme of the reporter V5-ATF4(1-63)-tGFP constructs used in this study. The tGFP gene was placed either in-frame or +1 nucleotide (nt) out-of-frame after the tryptophan codon at position 93 (W93). # and $ mark tGFP-containing and truncated protein products, respectively. (b) Dot plot depicting relative tryptophan levels of MD55A3-V5-ATF4(1-63)-tGFP+1 cells treated with IFNγ (250U/mL) for 48 h. (c) MD55A3 melanoma cells expressing V5-ATF4(1-63)-tGFP and V5-ATF4(1-63)-tGFP+1 were subjected to IFNγ treatment. Whole cell extracts were subjected to immunoblotting analyses using anti-V5, anti-tGFP, anti-Tubulin and anti-IDO1 antibodies. M: marker lane. Red arrows mark in-frame (#) and out-of-frame ($) products, as depicted in panel a. (n = 2 independent experiments). (d) Amino acid levels for tryptophan (W), tyrosine (Y), and phenylalanine (F) of the MD55A3-V5-ATF4(1-63)-tGFP+1 cells depleted of the indicated amino acids, as in Fig. 1d. Each bar represents the average of 3 independent experiments +/- stdev. (e) MD55A3 cells expressing V5-ATF4(1-63)-tGFP and V5-ATF4(1-63)-tGFP+1 were depleted for tryptophan for 48 h and then treated or not with the proteasome inhibitor MG132 (10μM) as indicated in the scheme in panel b. Whole cell extracts were subjected to immunoblotting analyses using anti-V5, anti-tGFP, and anti-Tubulin antibodies. Red arrows mark in-frame (#) and out-of-frame ($) products. (n = 2 independent experiments). (f) Line plots depicting the peptides detected following V5-IP/MS of lysates of MD55A3-V5-ATF4(1-63)-tGFP+1 cells from mock or IFNγ-treated conditions. The dashed line represents the site of the tryptophan 93 codon (W93) and the x-axis represents the in-frame part of the reporter protein before and after the tryptophan codon. (g) Dot-plot depicting log2 fold changes between mock and IFNγ-treated MD55A3-V5-ATF4(1-63)-tGFP+1 cells for the tryptic peptide intensities presented. Each dot represents the intensity of a unique peptide. Lines represent the average intensities of all peptides +/-stdev. (h) The same analysis as performed in panel f, but for mock and tryptophan-depleted MD55A3-V5-ATF4(1-63)-tGFP+1 cells. (i) The same analysis as performed in panel g, but for mock and tryptophan-depleted MD55A3-V5-ATF4(1-63)-tGFP+1 cells. (j) Heatmap depicting a log2 fold change between mock and tryptophan-depleted MD55A3-V5-ATF4(1-63)-tGFP+1 cells for amino acid substitution events for each of the amino acids in the tryptic peptide spanning the W93 codon. (k) Dot-plots depicting peptide intensity values in either mock (Ctrl) or amino acid depleted MD55A3-V5-ATF4(1-63)-tGFP+1 cells for the specific codon reassignments detected in the various depleted conditions, as indicated. Each dot represents an independent biological replicate and the line represents the average of the 3 replicates +/- standard deviation (stdev). (l-o) tGFP median intensity of reporter vectors encoding for tGFP, tGFPF26W, or tGFPF26A stably introduced into the indicated cell lines and conditions. Marked in dotted line is the highest value of the highest point in the background. Each dot represents a biological replicate and the line represents the average of the triplicates +/- stdev.

