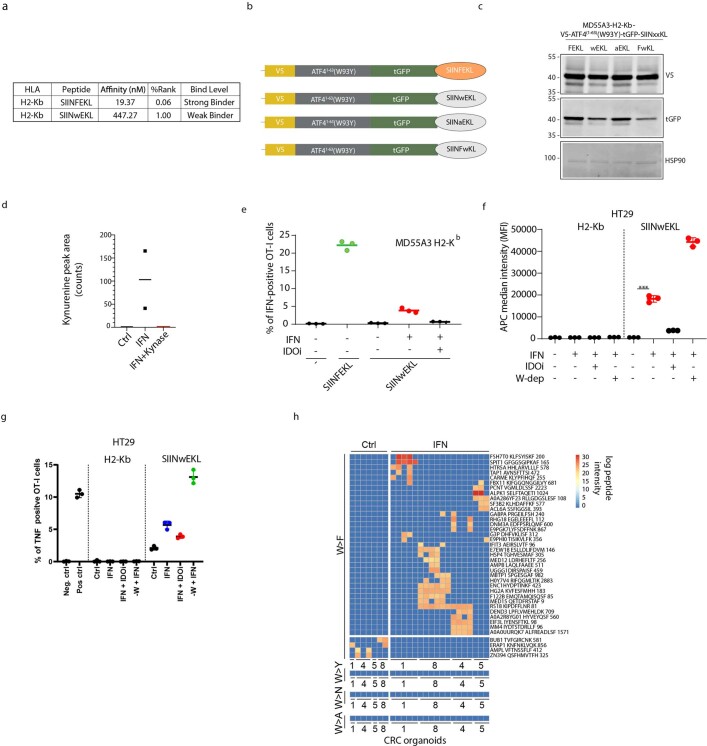
Extended Data Fig. 5. Presentation of substitutants at the cell surface.
(a) The binding affinity of SIINFEKL and SIINwKEL peptides to H2-Kb receptor was assessed by NetMHC 4.0. (b) A scheme of the reporter vectors used to assess the production, presentation and T cell activation by SIINFEKL and SIINwEKL. (c) Immunoblot analyses using anti-V5, anti-tGFP and anti-HSP90 antibodies demonstrate similar expression of the various tGFP-SIINxxKL reporters used in this study. Results are representative of 2 independent experiments. (d) MD55A3-V5-ATF4(1-63)-tGFP+1 cells were either treated with mock (Ctrl), IFNγ (IFN), or IFNγ with recombinant kynureninase (IFN+Kynase) for 48 h. Kynurenine levels in the medium were analysed by MS. Dots represent measurements relative to control from independent experiments, with the line indicating the mean of all samples. (e) MD55A3-H2-Kb control, SIINFEKL or SIINwEKL expressing cells, were pre-treated for 48 h with IFNγ (250U/mL) and IDOi (300 μM) as indicated, and used in co-cultures with OT-I-derived T cells for 12 h. T cell activation was assessed by flow cytometry analysis of intracellular IFNγ positivity. Dots represent values obtained from independent experiments. The lines represent the average of three independent experiments +/- stdev. *** P<0.001 by ordinary one-way ANOVA using Sidak’s multiple comparison test. (f) A dot plot depicting the APC median fluorescence intensity (MFI) of H2-Kb-bound SIINFEKL peptides in HT29 cells expressing H2-Kb (HT29-H2-Kb) or in combination with the V5-ATF4(1-63)-tGFP-SIINwEKL reporter. Each dot represents an independent biological replicate (n = 3). *** P<0.001 by ordinary one-way ANOVA using Sidak’s multiple comparison test. (g) Dot plot representing the percentage of TNFα positive OT-I T cells after 4 h of co-culture with HT29-H2-Kb or H2-Kb-SIINwEKL expressing cells pre-treated 48 h IFNγ (IFN, 250U/mL), with or without IDOi (300 μM) and W-depletion, as determined by flow cytometry. Dots represent values obtained from independent experiments. The lines represent the average of three independent experiments +/- stdev. (h) A heatmap depicting log2 peptide intensities in either control or IFN-treated patient-derived colorectal cancer organoid models for W>F, W>Y, W>N and W>A substitutant peptides.

