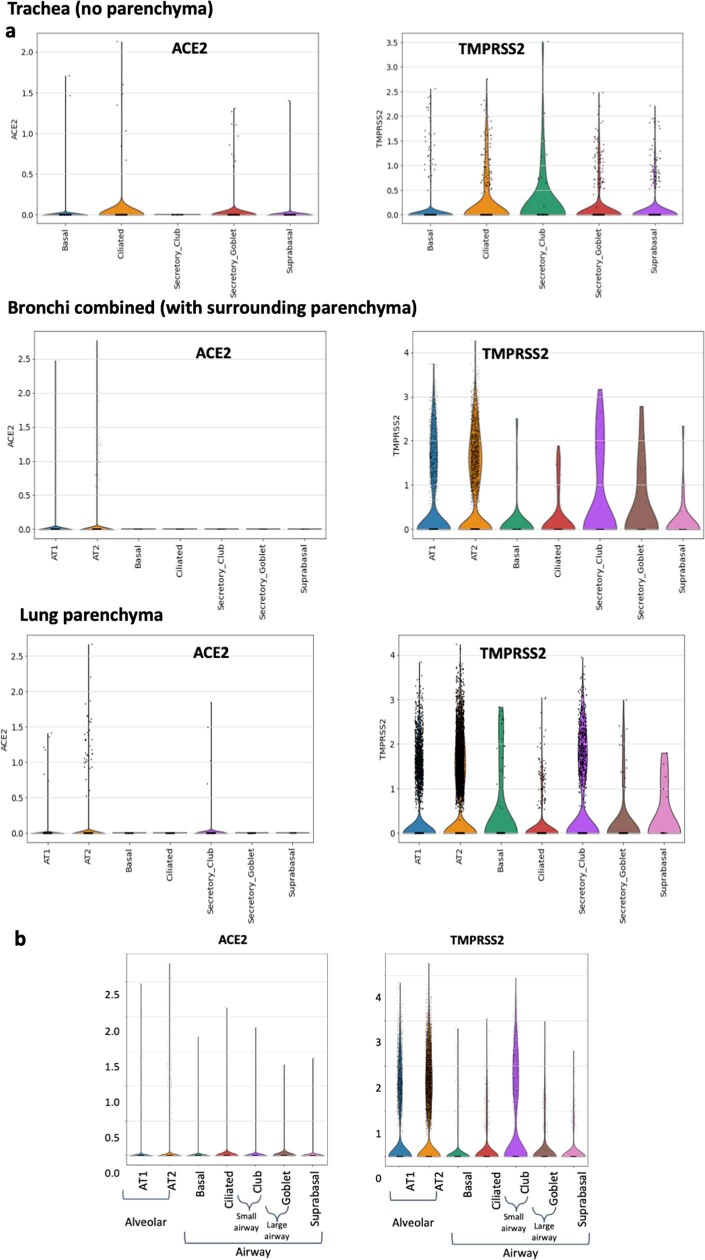
Extended Data Fig. 7. ACE2 and TMPRSS2 tissue expression levels by single cell RNAseq.
a. Log-normalized expression of ACE2 and TMPRSS2 genes in single-nucleus RNAseq data for indicated tissue types and. b. Log-normalized aggregrated expression of ACE2 and TMPRSS2 genes in single-nucleus RNAseq data from human alveolar (AT1 - alveolar type 1, AT2 - alveolar type 2 pneumocytes), and airway epithelial cells (basal, suprabasal, goblet and ciliated). Data are derived from in Madissoon et al.

