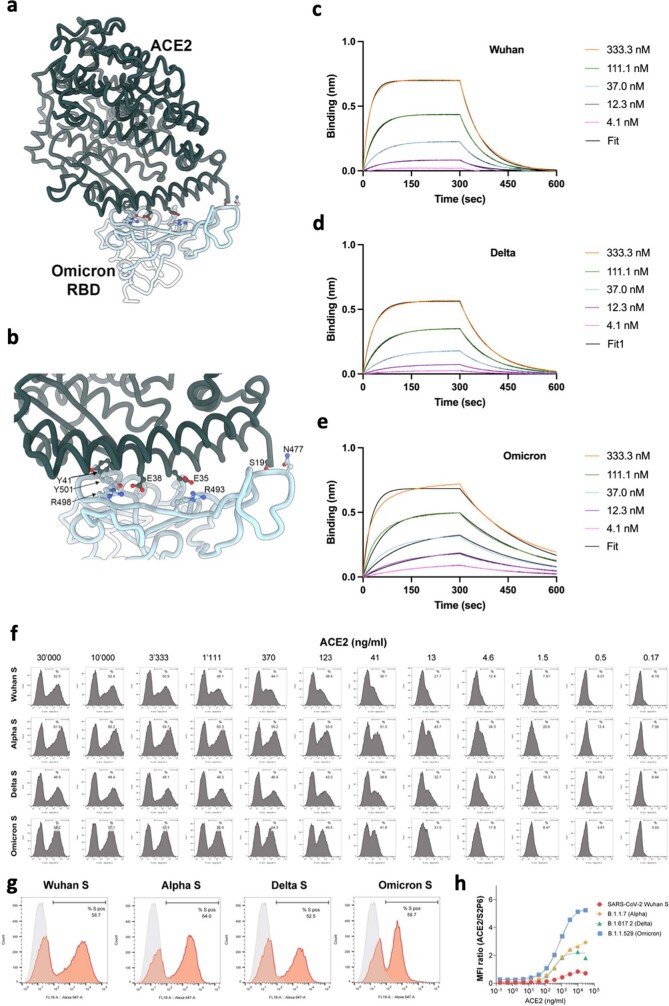
Extended Data Fig. 2. Omicron spike binding to ACE2.
a. Rendering of the contacts formed between the Omicron RBD (light blue) and human ACE2 (dark green) using PDB 7TN0 described in15 b. Zoomed-in view showing select amino acid side chains participating in remodelling of interactions between the Omicron RBD and ACE2. c–e. Biolayer interferometry binding analysis of human ACE2 to immobilized SARS-CoV-2 Wuhan-Hu-1 c. Delta d. or Omicron e. RBDs. Black lines correspond to a global fit of the data using a 1:1 binding model. f. Flow cytometry analysis of ACE2 binding to SARS-CoV-2 Wuhan, B.1.1.7 (Alpha), B.1.617.2 (Delta) or Omicron (B.1.1.529) spike proteins transiently expressed in ExpiCHO cells. g. Expression level of each spike as measured via binding by S2-subunit targeting S2P6 mAb. Grey histograms represent background florescence of cells stained with the secondary antibody only. h. Normalized ACE2 binding results based on spike protein expression levels. Values on the Y axis indicate the ratio between the mean fluorescence intensity (MFI) of positive cells stained for ACE2 binding and the MFI of the S2P6 positive cells. Data points in h. are mean of technical triplicates and data shown are representative two independent experiments.

