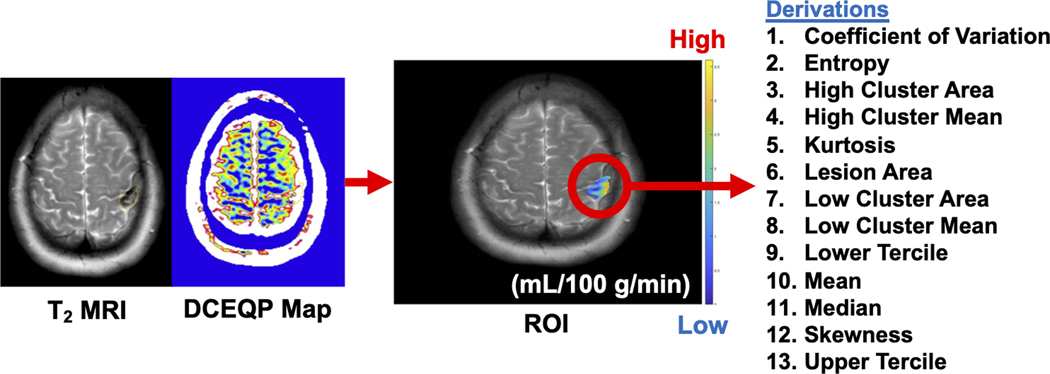
Figure 2: Schematic diagram of dynamic contrast-enhanced quantitative perfusion (DCEQP) map acquisition, imaging postprocessing, and calculation of the 13 respective vascular perfusion and permeability descriptors using MATLAB.

ROI: region of interest.
