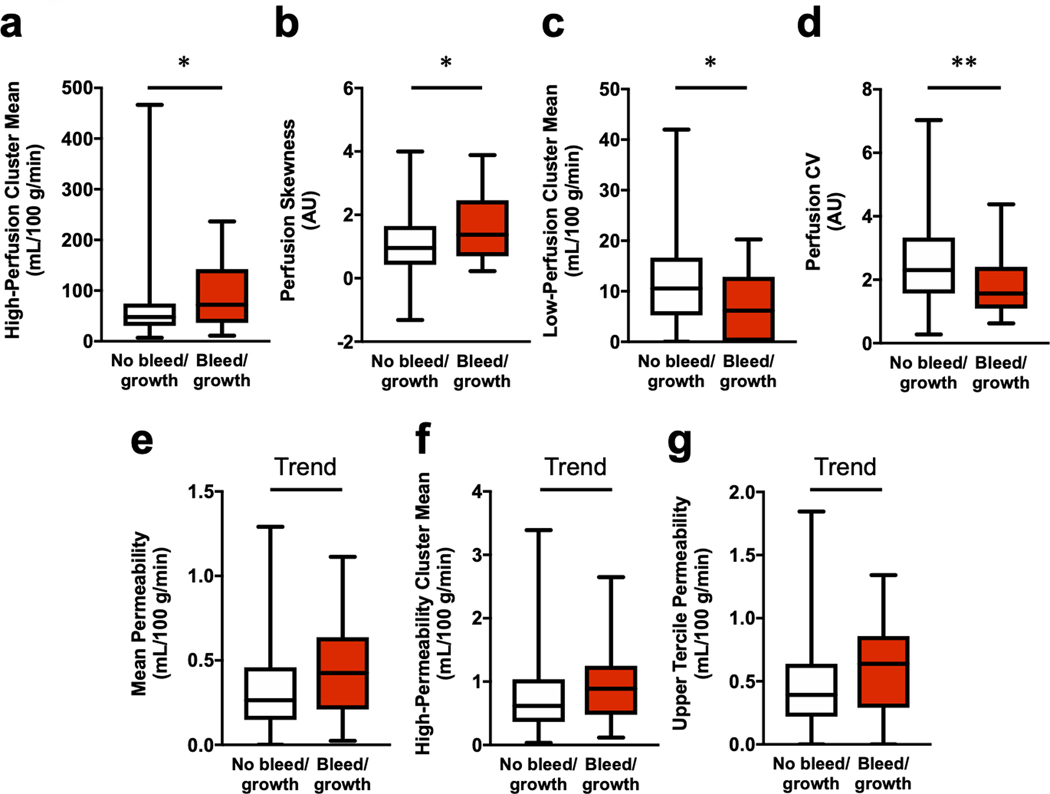
Figure 4: Univariate comparisons of perfusion and permeability descriptors between cavernous angiomas (CAs) with versus without bleed/growth within a year after imaging.

Perfusion (a–d). In CAs with bleed/growth, there were increased median values of (a) high-perfusion cluster mean (p=0.029) and (b) perfusion skewness (p=0.031), along with decreased (c) low-perfusion cluster mean (p=0.021) and (d) CV (p=0.004). Permeability (e–g). Additionally, there were higher trends of (e) mean permeability (p=0.078), (f) upper tercile permeability (p=0.065), and (g) high-permeability cluster mean (p=0.063) in CAs with bleed/growth. Boxes represent median and interquartile range. Bars represent range. Outliers with absolute studentized residual values of 3 or greater were excluded. Trend p<0.10, * p<0.05, ** p<0.01. AU: arbitrary unit; CV: coefficient of variation.
