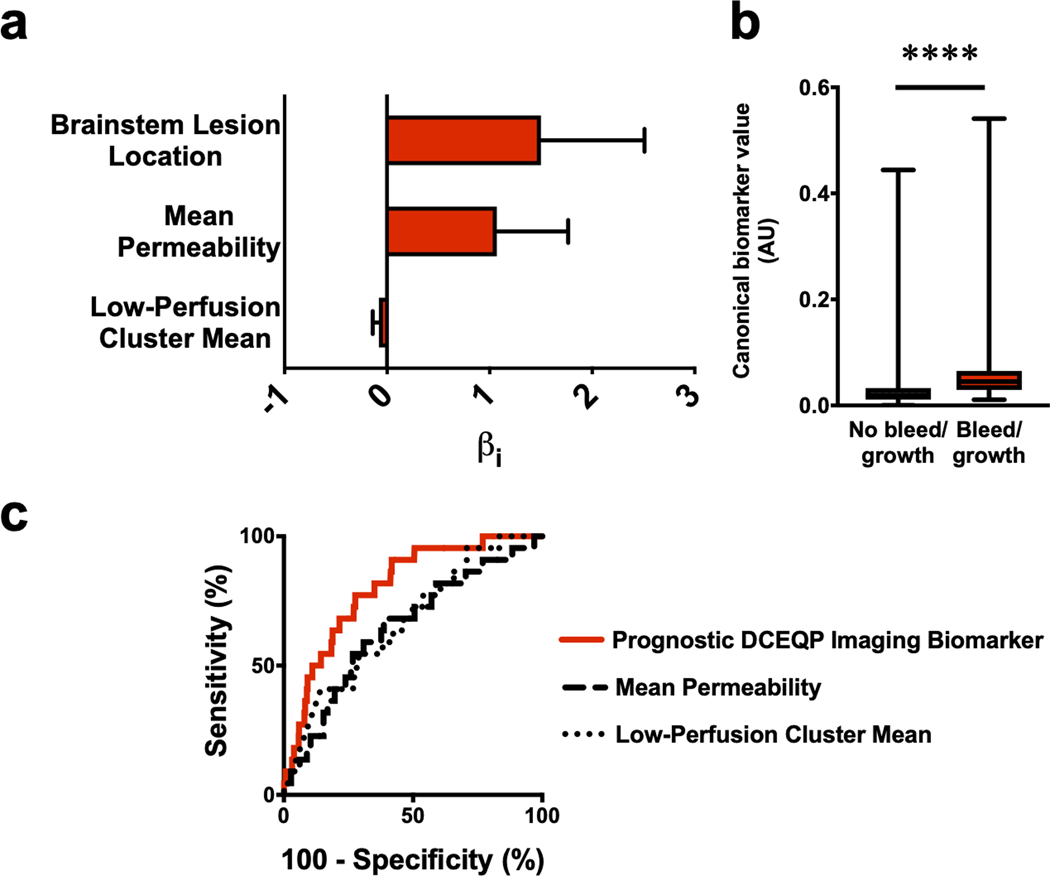
Figure 5: The best prognostic biomarker of cavernous angiomas (CAs) with bleed/growth within a year after imaging.

(a) The weighted βi coefficients of each covariate in the prognostic biomarker (Bayesian information criterion=201.5, McFadden R2=0.12); error bars indicate 95% confidence interval (CI). (b) Canonical score of the prognostic biomarker was higher (p<0.0001) in CAs with bleed/growth (median [interquartile range]=0.05 [0.03–0.07]) than in CAs with no bleed/growth within a year after imaging (0.02 [0.01–0.03]); boxes represent median and interquartile range, while bars represent range. (c) For predicting lesional bleed/growth, the prognostic biomarker (area under the curve [95% CI]=80% [72–88%], p<0.0001) was significantly better (p=0.01, FDR-corrected) than mean permeability (65% [53–76%], p=0.020) or was significantly better (p=0.04, FDR-corrected) than the low-perfusion cluster mean (67% [56–78%], p=0.007) individually. Mean permeability and low-perfusion cluster mean did not significantly outperform each other (p=0.79, FDR-corrected). **** p<0.0001. AU: arbitrary unit; DCEQP: dynamic contrast-enhanced quantitative perfusion; FDR: false discovery rate.
