

1. Introduction
Fibromyalgia syndrome (FMS) is a common chronic primary pain condition[18] with global prevalence ranging from 1–12.5% in women and 0–5.1% in men[20; 74]. Along with chronic widespread pain, this syndrome is characterized by presence of fatigue, sleep disturbance, depression, and cognitive difficulties. This syndrome is often associated with an array of other symptoms like restless leg syndrome, irritable bowel syndrome, vulvodynia, irritable bladder, xerostomia, and dry eyes.[4] The diagnosis of FMS lacks objective biomarkers or reliable and valid clinical measures.[31; 88] Since the diagnostic criteria are based on clinical assessment and not the pathophysiology of FMS, this often leads to misdiagnosis and contributes to heterogeneity among the patient group. Although therapeutic strategies including physiotherapy, cognitive behavioral therapy, antidepressants, and neuropathic pain medications may have some efficacy in reducing pain and improving quality of life, the magnitude of these improvements is often not clinically meaningful to the patients.[65] Lastly, incomplete understanding of the etiology and pathogenesis of FMS is a major obstacle in modeling the disease in animal assays, further hampering pre-clinical research. In summary, the lack of objective diagnostic markers and poorly understood aetiopathogenesis of FMS are the two most important obstacles in diagnosing, treating, and researching FMS.
Both central and peripheral nervous systems have been shown to be affected in FMS. Changes in gray matter volume in specific regions of the brain, decreased functional connectivity in the descending pain-modulating system, and increased activity in the pain matrix are suggestive of central sensitization in FMS.[14; 84; 91] Increased peripheral nerve demyelination[15], decreased dermal and intra-epidermal nerve fibers in FMS patients[16; 28; 29], and the presence of sensory symptoms[47] such as paraesthesia, hyperalgesia, and allodynia are suggestive of peripheral nerve involvement in FMS.
Epidemiological studies have shown that allergic[6; 7; 83] and autoimmune[19; 33] comorbidities are common among FMS patients. Targeted exome sequencing [92], and proteome-wide[38] studies have identified molecular signatures consistent with low-grade chronic inflammation in FMS patients. Transcriptome-wide approaches found the relevance of immune response pathways and homeostasis in FMS.[60] Previous studies also suggest a defective cytotoxic immune response [8], increased activation of lymphocytes, and increased expression of cell adhesion molecules on neutrophils and monocytes[61] in FMS. However, specific immune players and neuro-immune interactions involved in the pathophysiology of FMS remain to be discovered.[78] To further our understanding of the immune system’s involvement in FMS, here we aimed to identify immunophenotypic differences between individuals with and without FMS in a hypothesis-free manner.
2. Methods
2.1. The Canadian cohort
2.1.1. Study population
The sample size was based on a previous study[77] and was calculated using PS: Power and Sample Size Calculation tool [26]. Forty-four FMS patients and 46 matched controls were deemed sufficient to reject the null hypothesis that the population means of the experimental and control groups are equal with probability (power, 1 - β) 80% and type I error (α) ≤ 5%. The Canadian cohort of FMS patients and controls was collected under the research project approved by the institutional review board (IRB), Faculty of Medicine, McGill University (IRB Study Number A05-M50-14B). Individuals with a clinician-rendered diagnosis of FMS based on the 2010 American College of Rheumatology diagnostic criteria [89] attending the rheumatology clinic or the Alan Edwards Pain Management Unit of the Montreal General Hospital (MGH, McGill University Health Centre, MUHC) were invited to participate. FMS participants were also recruited by advertising our study among members of the Association de Fibromyalgie du Quebec. Additionally, recruitment of both FMS participants and controls included word-of-mouth, advertising the study in local newspapers, at MUHC and McGill University bulletin boards and websites, and through mass emails.
The following inclusion criteria were applied to determine eligibility to participate in this study: the ability to write and speak in English and/or French and provide signed and dated informed consent, and, aged 40 years and more. Individuals were excluded from the study if they had other diagnosed pain conditions that could explain their pain, a medical or psychiatric condition that was uncontrolled or had prior or current drug and/or alcohol abuse. Lastly, in control participants, FMS diagnosis was excluded by medical examination by the clinician using the 2010 diagnostic criteria[89]. In addition, control participants must never have been diagnosed with any chronic pain condition or have a history of depression.
2.1.2. Outcome measures
The primary outcome measure for this study was the case status for FMS. Apart from age, gender, body mass index (BMI), and detailed medical history, other outcome measures collected are summarized in Supplementary Table 1. All demographic, anthropometric, clinical, and patient-reported outcomes were collected and managed using the Research Electronic Data Capture (REDCap) tool[39] which is a secure, web-based application designed to support data capture for research studies hosted at the Research Institute of the McGill University Health Centre (RI-MUHC).
2.1.3. Blood sample collection
For the described study, 15 mL of peripheral blood were collected in ethylene diamine tetra-acetic acid (EDTA) vacutainer tubes from each participant from the median cubital vein. Two and a half mL of whole blood were preserved in PAXgene Blood RNA Kit™ (762174, PreAnalytiX, Germany) and stored at −80°C for RNA extraction. Peripheral blood mononuclear cells (PBMCs) were fractionated from the remaining whole blood using a Ficoll-Paque PLUS™ (17144002, GE Healthcare Life Sciences, Canada)-based density gradient and SepMate™-50 tubes (85450, STEMCELL Technologies Canada Inc.).[82] PBMCs (3 vials with 5 million cells in each) were resuspended in heat-inactivated human plasma-derived serum (H4522, Sigma-Aldrich, Canada) and 10% dimethyl sulfoxide (DMSO, D128-500, Fisher Scientific, Ontario, Canada), and, cryopreserved in liquid nitrogen for flow cytometry and NK activation assays.
2.1.4. mRNA sequencing
RNA from whole blood was isolated from PAXgene collection tubes according to the provider’s protocol (PreAnalytiX GmbH, 08/2005, REF: 762174). The average mRNA concentration was 120 ng/μL and 25 μL of mRNA per sample was sequenced using Illumina’s NovaSeq™ 6000 S2 SR100 platform at Génome Québec, Montreal, QC, Canada.
2.1.5. Flow cytometry
One vial of the cryopreserved PBMCs was split into three to stain for cytokine production (“cyto panel”), chemokine receptor expression (“chemo panel”), and regulatory T cells or Tregs (“Treg panel”). Another vial was split into two to stain for B cells, monocytes and dendritic cells or DCs (“BMD panel”), and, natural killer (NK) cells (“NK panel”). Experimental design, selection of the antibodies and fluorochromes, antibody concentrations, and flow cytometer photomultiplier tubes’ (PMTs) voltages were optimized to minimize technical artifacts in downstream computational analysis.[11] Details of the excitation lasers, channel filters, clones, antibody isotype, fluorochromes, manufacturer and catalog number, and the titer of reagents used for all the flow cytometry panels are summarized in Supplementary Table 2. Cryopreserved PBMCs were rapidly thawed in a 37°C water bath, resuspended in Isocove’s Modified Dulbecco Media (IMDM) with 10% fetal bovine serum (FBS), and incubated at 37°C in a 5% CO2 incubator for 1 hour to improve detection of cell surface markers.[55] Viability staining was performed using Fixable Viability Dye eFluor™ 780 (65-0865-14, Thermo Fisher Scientific, Waltham, MA USA) and Zombie NIR™ (423106; BioLegend, San Diego, CA USA) and nonspecific antibody binding was minimized by the use of TruStain FcX reagent™ (422302; BioLegend, San Diego, CA USA), as per the manufacturer’s instructions. Subsequently, the cells were stained for extracellular markers. Intracellular staining was preceded by fixation with 2% paraformaldehyde and permeabilization as per the manufacturer’s protocol (421002; BioLegend, San Diego, CA, USA). Following the staining and fixation, the PBMCs were stored at 4°C in the dark for data acquisition on the subsequent day. Unstained cells, single-stained cells, and fluorescence minus one (FMO) staining were used as controls. UltraComp eBeads™ were used for compensation of all fluorochromes. Using SPHERO™ alignment particles, the coefficients of variation (CVs), peak channels, and histogram distributions were aligned before every flow cytometry run to standardize data acquisition across all the batches. Around two million total events were acquired from each sample on LSRFortessa™ instrument (BD Biosciences) at the McGill University’s flow cytometry and cell sorting facility and the immunophenotyping platform of RI-MUHC. Acquisitions of all the batches were performed within 24 hours of staining.
2.1.6. NK activation assay
One vial (5 million cells) of cryopreserved PBMCs from randomly chosen 14 cases and 14 controls were thawed, counted, and resuspended in RPMI 1640 medium supplemented with 10% FBS, 2 mM l-glutamine, 50 IU/ml penicillin, and 50 mg/ml streptomycin (henceforth, R10 medium) at 4 × 10⁶/mL for overnight resting. Each sample was split into four: two were stimulated, or not (as a negative control), by co-culture with human leukocyte antigen null (HLA−/−) cells and two were used in an antibody-dependent NK activation (ADNKA) assay.
The HLA−/− assay is described in detail elsewhere.[81] For this assay, lymphoblastoid cell line (LCL) 721.221, a kind gift from Dr. Galit Alter (Ragon Institute, Harvard University, Cambridge, MA, USA) to Dr. Nicole Bernard, was used to stimulate NK cells. In short, rested PBMCs (effector) were cocultured with 221 cells (target) at an E:T ratio of 5:1 in 200 μL of R10 in V-bottom 96-well plates. PBMCs cultured alone in R10 served as an unstimulated negative control.
Details of the ADNKA assay are described elsewhere.[27; 57] CEM.NKr.CCR5 (CEM) cells (CEM; from the NIH AIDS Reagent Program, Division of AIDS, NIAID, NIH, Germantown MD, USA, from Dr. Alexandra Trkola) cells infected with the viral isolate NL4-3–Bal–IRES–HSA were sorted for infected CEM cells (iCEM)[27; 40] HIV+Ig (pooled plasma from HIV infected donors) (Catalog #3957, HIV‐IG from NABI and NHLBI) obtained from the NIH AIDS Reagent Program or HIV-Ig served at the opsonizing antibodies. 1×10⁶ cells (50 μL) iCEM cells and 50 μL of pre-diluted opsonizing antibodies (HIV+Ig or HIV−Ig, 50 μg/mL in R10) were added to the rested PBMCs (effector) in V-bottom 96-well plates (E:T ratio of 1:1).
One hour after the initiation of the cocultures, GolgiStop™ (cat. 554724; BD Biosciences, Mississauga, ON, Canada) and Golgiplug™ (cat. 555029; BD Biosciences, Mississauga, ON, Canada) were added. BV711-conjugated anti-CD107a (5 μL/well; cat. 328640; BioLegend) was also added at the beginning of the coculture. Both the cocultures (HLA−/− and ADNKA) were incubated for six hours at 37°C in a humidified 5% CO2 incubator. After incubation, the plates were wrapped in aluminum foil and stored in a 4°C fridge overnight. The next day, the cells were stained with UV Live/Dead™ Fixable Blue cell stain kit, as per manufacturer’s directions (cat. L34961; Thermofisher, Waltham, MA) and with reagents described in Supplementary Table 2 (NKA panel).
2.2. The German cohort
The second cohort of FMS patients were enrolled in the research project approved by the Ethics Committee of the University of Würzburg, Medical Faculty Germany, (#121/14), and all study participants gave written informed consent. The details of the study population and following skin biopsy procedures are summarized elsewhere.[29] In short, 382 participants were screened and 117 women (median age of 52 years, range: 22–75 years) with FMS were enrolled at the Department of Neurology, University of Würzburg, Germany. Inclusion criteria were age ≥18 years and a diagnosis of FMS made by a neurologist according to the most current diagnostic criteria at the time.[29] The Fibromyalgia Survey Questionnaire (FSQ) that assesses the key symptoms of fibromyalgia syndrome was also administrated and FSQ severity score was calculated.
2.2.1. Skin microscopy
Skin punch biopsies measuring 6 mm were obtained from the right lateral lower leg and upper thigh of the German cohort participants. The skin punch biopsies obtained from the lower legs of 17 FMS patients and 11 controls were randomly selected for this study. These samples were processed to determine the intraepidermal nerve fiber density (IENFD) as previously described[30]. In brief, 40 μm cryosections were immunoreacted with rabbit-anti-human antibodies against the pan-axonal marker protein-gene product (PGP) 9.5 (1:1,000; Zytomed, 516–3344) and a donkey-anti-rabbit Cy3 coupled secondary antibody (1:100; Dianova, 711-545-152). IENFD was determined following standardized counting rules[53] by an investigator blinded to subject allocation on an Axiophot™ microscope (Zeiss, Oberkochen, Germany) equipped with an AxioCam MRm camera (Zeiss, Oberkochen, Germany) and SPOT software (Diagnostic Instruments, Sterling Heights, MI, USA). IENFD was defined as normal if there were ≥ 5.4 fibers/mm according to the normative values from the skin biopsy laboratory of Würzburg University.
For the investigation of unique long-16 binding protein (ULBP, ligand for the CD314 or natural killer group 2D, NKG2D, receptor) and NK cells, 20-μm sections were prepared and two sections were loaded per slide. The slides were blocked with 10% bovine serum albumin (BSA) in phosphate buffer saline (PBS) for 30 minutes at room temperature. Double-labeling was performed using anti-ULBP goat polyclonal antibody (Ab,1:50; R&D 1298) as a marker for NK cell receptor, PGP9.5 rabbit anti-human Ab (1:200; Zytomed 516–3344) as an axonal marker, anti-CD56 goat monoclonal Ab (mAb, 1:100; R&D AF2408) as a marker for NK cells and CD3 rat anti-human mAb (1:500; BIO-RAD, MCA1477) as a marker for T lymphocytes, as primary antibodies in 10% BSA/PBS and 0.3 Triton. The sections were incubated overnight at 4°C with the primary antibodies. Followed by incubation, visualization was performed with Cy3-labelled donkey anti-goat Ab (1:50; Dianova 705-165-147), Alexa Fluor 488-labelled donkey anti-rabbit Ab (1:400; Dianova 711-545-152), Alexa Fluor 488 donkey anti-goat Ab (1:200; Jackson 705-545-147), and Cy3 goat anti-rat Ab (1:100; Dianova 7112-165-167). Nuclei were stained with 1.5 μg/mL 4′,6-diamidino-2-phenylindole di-lactate (DAPi), and Vectashield™ (Vectorlabs, H-1000–10) was used as mounting medium. Quantification of ULBP+ sup-epidermal plexus (SEP), and CD56+ nucleated cells was performed by an independent investigator blinded to subject group allocation on an ApoTome™ microscope (Zeiss, Oberkochen, Germany), equipped with an AxioCam™ MRm camera (Zeiss). The area of interest was 100 μm from the dermis-epidermis border. All the assessments were performed with a 40x objective and optical sectioning. Images were Z-stacked to follow the nerve fibers and NK cells. Segments of SEP located in the zone of 100 μm from the basement membrane were counted regardless of their length. Then, each segment was checked for ULBP positivity one by one as the ratio and degree of ULBP staining of SEP could show variability even within a section. Then, the percentage of ULBP positive SEP was calculated by dividing the number of ULBP stained SEPs by the number of total SEPs. The CD56+ NK cells, which were alone or in contact with subepidermal neural plexus segments, were counted manually. As Schwann cells also expressed CD56, the cells that had a typical ellipsoid nucleus along the nerve fibers were excluded.
2.3. Data analysis
2.3.1. Flow cytometry
Flow cytometry data were compensated using Flowjo v10.7.3 (Treestar, Ashland, OR). Cells of interest were identified as per the gating strategy described in Supplementary Figure 1A. Data from all five flow cytometry panels were analyzed using VoPo[79]. In brief, the cells were clustered into coherent subpopulations based on the expression of all cell phenotype markers using a robust bootstrapped meta-clustering algorithm. A random forest algorithm was applied to the dataset comprised of all cell cluster features to estimate the magnitude of differences in features separating the controls from the patients. Using a leave-group-out cross-validation procedure, the Random Forest model predicted the probability that each sample belonged to the patient group. The p-value (p) from a Wilcoxon Rank Sum Test was used to test the null hypothesis that the predicted probabilities of a sample to be from a patient or control were equal. As this approach does not rely on an individual cell-to-population partition but instead integrates multiple clustering solutions to predict patient phenotype, it has less variability compared to individual solutions. Finally, cells were projected using t-Distributed UMAP (t-UMAP) into two dimensions for visualization using the uwot R package v0.1.9.
2.3.2. Pathway analyses
The enrichment of immune cell type activation pathways in FMS patients compared to controls was estimated via the transcriptomics level and genomics level approaches. Total mRNA from the whole blood was sequenced as described earlier. The transcriptomics data were mapped on the human genome GRCh37/hg19 using the STAR aligner[25], then featureCount was used to count reads mapped to each gene[56]. The analysis for differential gene expression between FMS and controls was performed using DEseq2[59] in each sex separately, then combined using the inverse variance-based approach proposed in METAL[87]. The combined DEseq2 result was analyzed by using fgsea [46] to infer pathway-level summaries. The fgsea algorithm assigned a P-value for each pathway from evidence of concerted up- or down-regulation of the pathway’s genes based on the transcriptomics data.
At the genomics level, we first performed a genome-wide association study (GWAS) in the UK Biobank (UKB) cohort, under UK biobank application no. 20802.[2; 80] Cases were defined as individuals reporting fibromyalgia for data field 20002 “Non-cancer illness code, self-reported” or with generalized pain all over the body (n=8,086) for data field 6159, while controls defined as individuals with no reported pain (n=197,050) for data field 6159. The GWAS was computed using SAIGE, taking into account the disproportionate case-to-control ratio and cryptic relatedness.[93] Sex, age, genotyping array, and the largest 40 principal components were used as co-variables. The second GWAS was performed in the HUNT study.[48] There, cases were defined as per the American College of Rheumatology’s 2016 criteria (n=2,818), while controls as individuals with no pain (n=16,901). The GWAS was computed using BOLT-LMM[58], with birth-year, sex, genotyping batch, and the first four principal components as co-variables. Single nucleotide polymorphism (SNP)-level summary results from both UKB and HUNT were used to derive gene-level summary results for each cohort using MAGMA[24]. MAGMA was used again to perform a meta-analysis of both UKB and HUNT studies, still at the gene level. Finally, the gene-level summary information was used by MAGMA to infer pathway-level summaries. The MAGMA algorithm assigned a P-value for each pathway from evidence of association between the MAGMA-assigned gene-level Z-scores and genes membership to the pathway. Gene-level summary data assigned by MAGMA took into account linkage disequilibrium between neighboring SNPs.
Pathway analyses on both transcriptomics (via fgsea) and genetics (via MAGMA) data were performed using the Gene Ontology (GO)[32] (December 2020 version from http://baderlab.org/GeneSets). Pathways were restricted to circulating immune cell types for genes involved in immune cell activation and their regulation. As recommended[75], pathways with more than 1000 genes or less than 10 genes were excluded from the analyses. We plotted the FDR-adjusted P-values for pathways for transcriptomics and genetics, and adjusted within each set separately.
2.3.3. Other data analyses
Results from NK activation assays were analyzed using mixed model analyses with age, sex, and BMI as fixed effects, and, batch and sample ID as random effects. R package lme4 v1.1.26 was used. Analysis of variance (ANOVA) with Tukey’s correction and Pearson’s product-moment correlation was used for analyzing skin biopsy results. R package ggplot2 v3.3.2 was used for making the plot. All statistical analyses were performed using R v4.0.3. Lastly, the entire experimental plan is illustrated in Figure 1.
Figure 1:
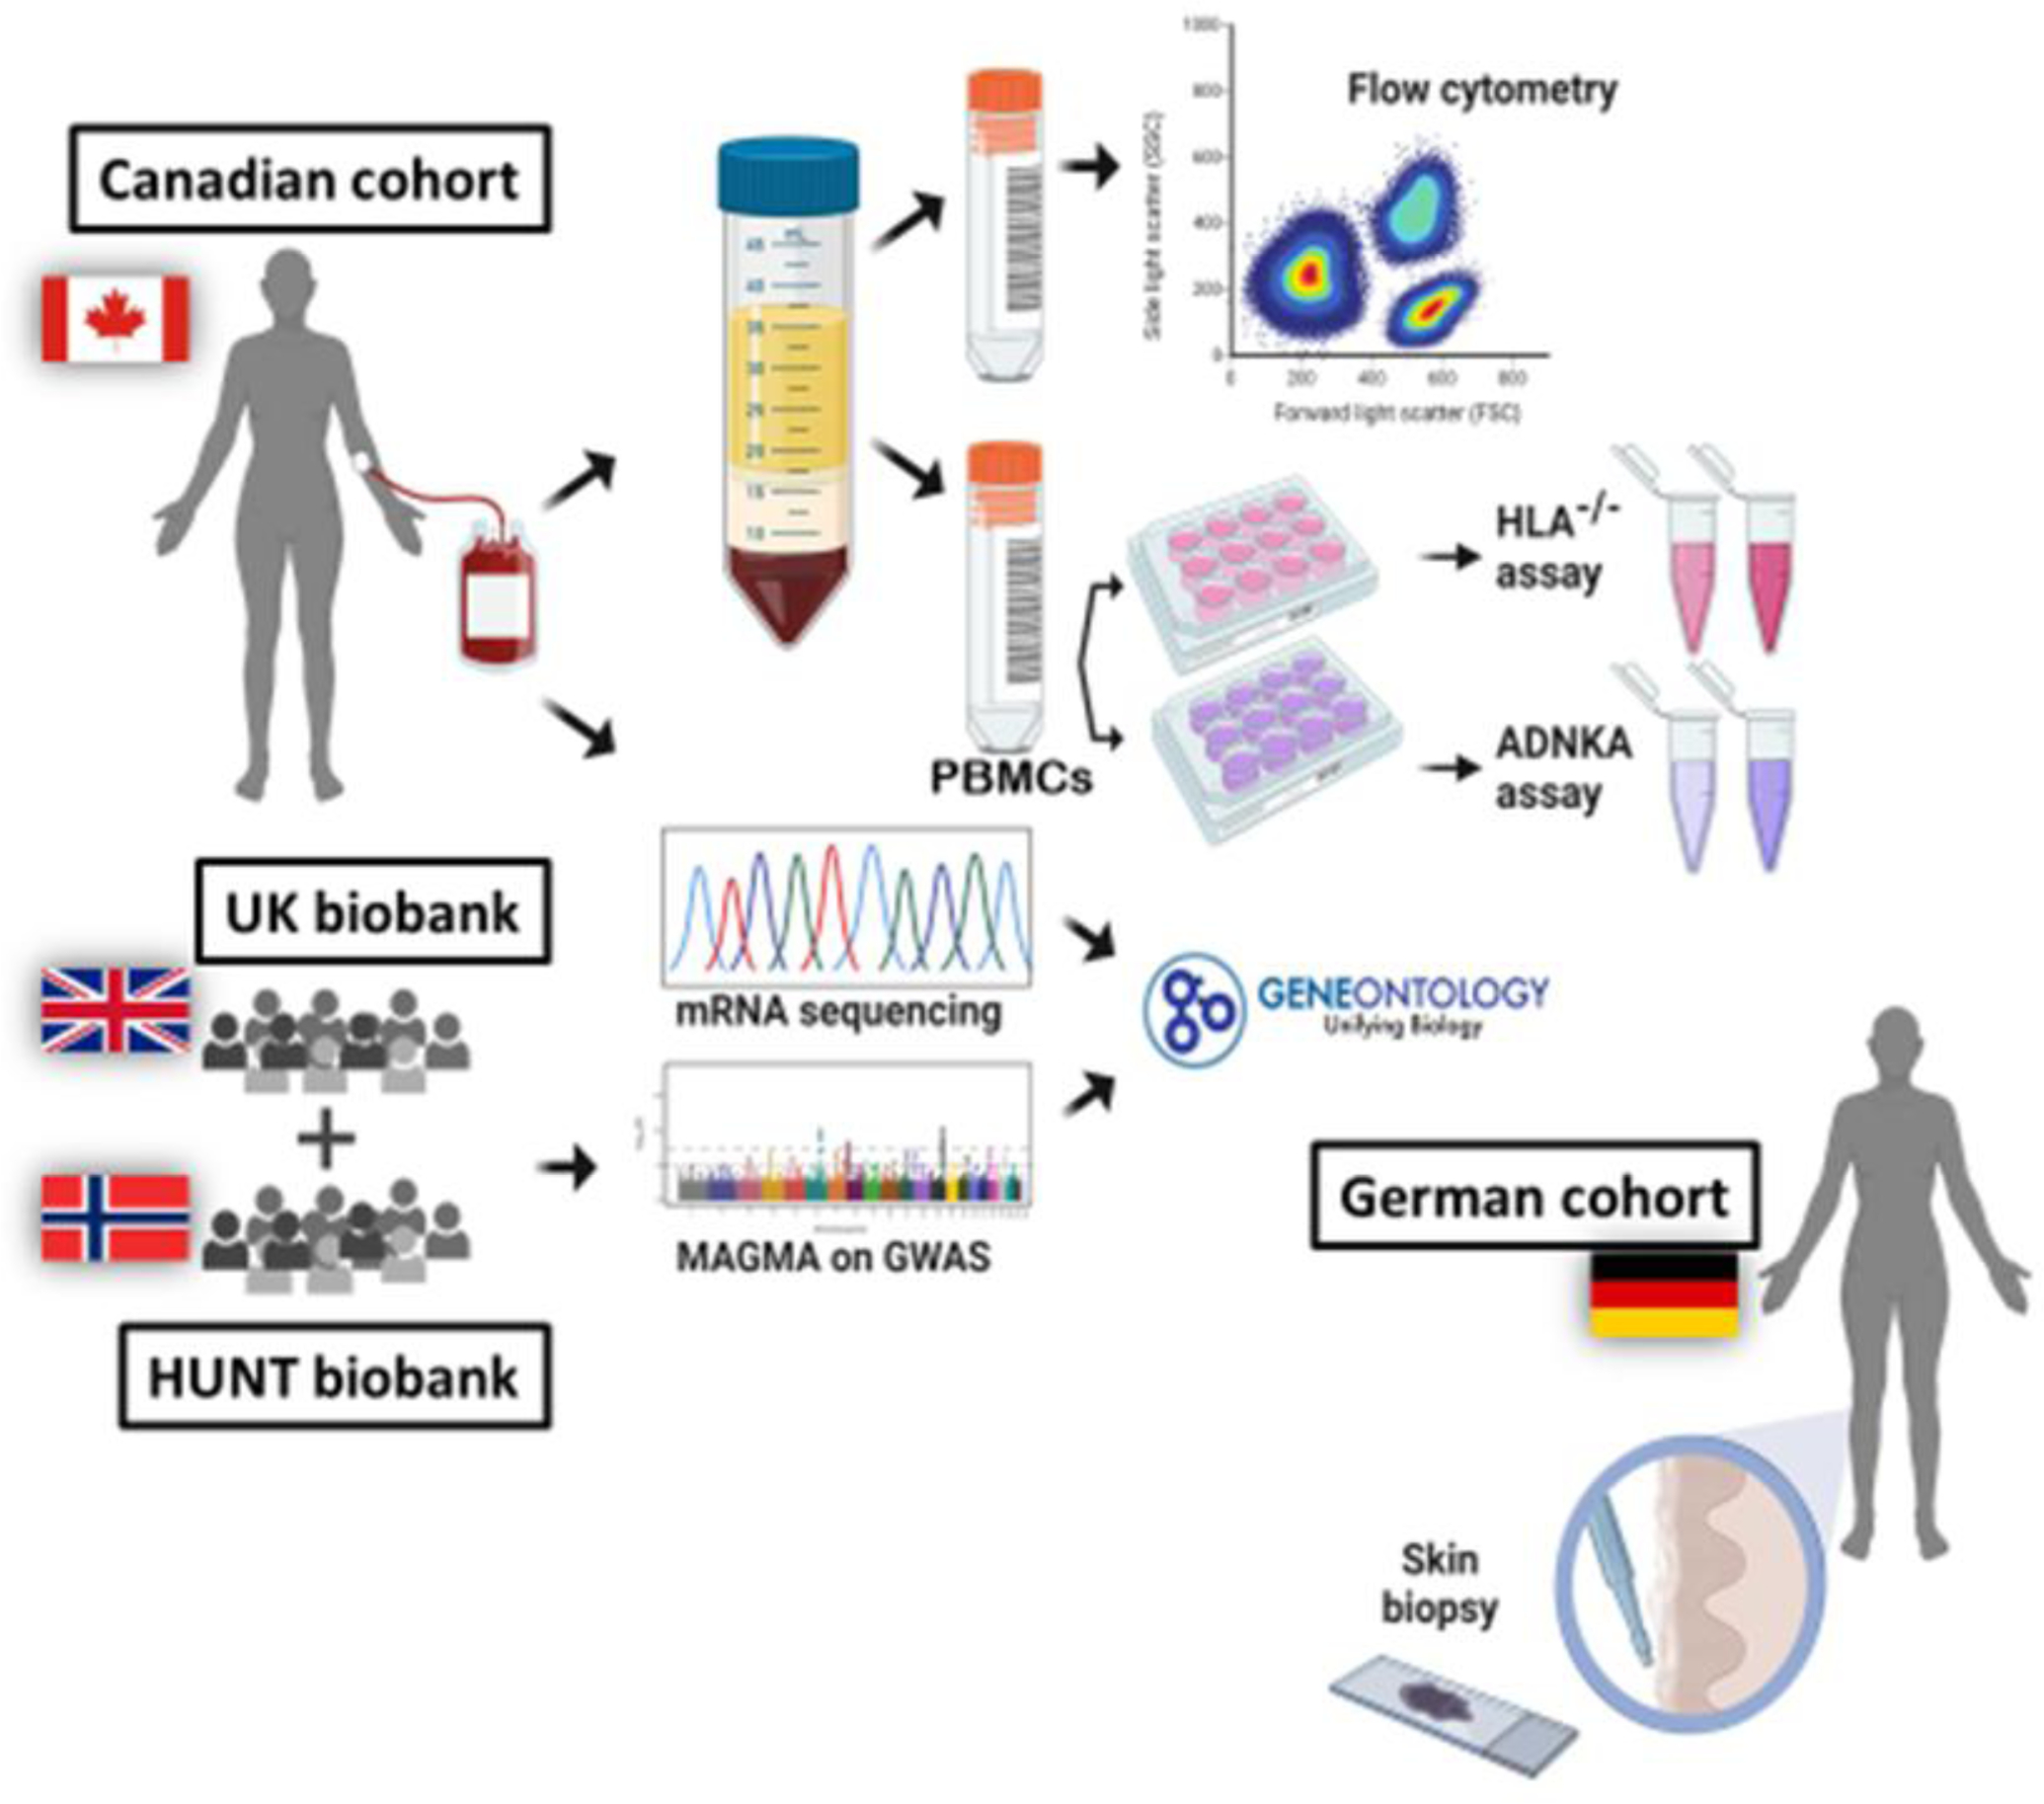
The experimental design. Whole blood from the Canadian cohort was split for isolating peripheral blood mononuclear cells (PBMCs) and for mRNA sequencing. PBMCs were aliquoted for cryopreservation and used for immunophenotyping using flow cytometry and natural killer (NK) activation assays. mRNA was isolated and sequenced from the whole blood of the same cohort and was used for differential pathways analysis using Gene Ontology (GO) database. GWAS summary results derived from the UK and the HUNT biobanks were also used for pathway analysis. Immunofluorescent staining was performed on the skin biopsies from the German cohort. (Created with BioRender.com.)
3. Results
3.1. Characteristics of the Canadian cohort
Blood samples were collected from 90 participants, of whom 44 were diagnosed as FMS patients. Similar to the previously reported prevalence of FMS[74], 97.7% of the cases were women. Hence, most of the recruited controls were women (91.3%) to match the number of cases. Mean age and BMI did not differ significantly between the control group and the FMS patients (Table 1).
Table 1:
Characteristics of the Canadian cohort
| Controls (n = 46) | Cases (n = 44) | Total (N = 90) | p-value | |
|---|---|---|---|---|
| Age | 0.960 | |||
| Mean (SD) | 55.6 (9.7) | 55.5 (8.3) | 55.6 (9.0) | |
| Range | 40.0 – 77.0 | 40.0 – 73.0 | 40.0 – 77.0 | |
| Gender | 0.361 | |||
| Women | 42 (91.3%) | 43(97.7%) | 85 (94.4%) | |
| Men | 4 (8.7%) | 1 (2.3%) | 5 (5.6%) | |
| BMI | 0.170 | |||
| N-Miss | 3 | 2 | 5 | |
| Mean (SD) | 26.4 (5.8) | 28.4 (7.8) | 27.3 (6.6) | |
| Range | 17.9 – 40.9 | 18.8 – 57.1 | 17.9 – 57.1 | |
| Highest pain ϯ | < 0.001 | |||
| Mean (SD) | 2.7 (6.3) | 24.9 (19.9) | 13.5 (18.3) | |
| Range | 0.0 – 28.5 | 1.0 – 90.0 | 0.0 – 90.0 | |
| Average pain ϯ | < 0.001 | |||
| Mean (SD) | 2.4 (4.5) | 17.6 (13.6) | 9.7 (12.5) | |
| Range | 0.0 – 24.0 | 0.0 – 52.5 | 0.0 – 52.5 | |
| Lowest pain ϯ | < 0.001 | |||
| Mean (SD) | 1.0 (2.7) | 6.7 (8.8) | 3.8 (7.0) | |
| Range | 0.0 – 15.0 | 0.0 – 50.0 | 0.0 – 50.0 | |
| % day in pain * | < 0.001 | |||
| Mean (SD) | 37.3 (44.6) | 96.2 (17.6) | 65.7 (45.2) | |
| Range | 0.0 – 100.0 | 12.0 – 100.0 | 0.0 – 100.0 | |
| No. of painful sites * | < 0.001 | |||
| N-Miss | 0 | 1 | 1 | |
| Mean (SD) | 2.8 (3.0) | 13.0 (3.5) | 7.7 (6.1) | |
| Range | 0.0 – 12.0 | 5.0 – 19.0 | 0.0 – 19.0 | |
| Headache * | 0.023 | |||
| No | 20 (44.4%) | 9 (21.4%) | 29 (33.3%) | |
| Yes | 25 (55.6%) | 33 (78.6%) | 58 (66.7%) | |
| Abdominal cramps * | < 0.001 | |||
| No | 29 (64.4%) | 12 (28.6%) | 41 (47.1%) | |
| Yes | 16 (35.6%) | 30 (71.4%) | 46 (52.9%) | |
| Depression * | < 0.001 | |||
| No | 38 (84.4%) | 21 (50.0%) | 59 (67.8%) | |
| Yes | 7 (15.6%) | 21 (50.0%) | 28 (32.2%) | |
| Fatigue * | < 0.001 | |||
| No problem | 12 (26.7%) | 0 (0.0%) | 12 (13.8%) | |
| Slight or mild problem | 25 (55.6%) | 5 (11.9%) | 30 (34.5%) | |
| Moderate problem | 2 (4.4%) | 7 (16.7%) | 9 (10.3%) | |
| Severe problem | 6 (13.3%) | 30 (71.4%) | 36 (41.4%) | |
| Trouble thinking/remembering * | < 0.001 | |||
| No problem | 25 (55.6%) | 1 (2.4%) | 26 (29.9%) | |
| Slight or mild problem | 17 (37.8%) | 16 (38.1%) | 33 (37.9%) | |
| Moderate problem | 0 (0.0%) | 2 (4.8%) | 2 (2.3%) | |
| Severe problem | 3 (6.7%) | 23 (54.8%) | 26 (29.9%) | |
| Overall sleep quality # | < 0.001 | |||
| Very good | 11 (24.4%) | 3 (7.1%) | 14 (16.1%) | |
| Fairly good | 26 (57.8%) | 9 (21.4%) | 35 (40.2%) | |
| Fairly bad | 7 (15.6%) | 17 (40.5%) | 24 (27.6%) | |
| Very bad | 1 (2.2%) | 13 (31.0%) | 14 (16.1%) | |
| Waking up tired (unrefreshed) * | < 0.001 | |||
| No problem | 19 (42.2%) | 1 (2.4%) | 20 (23.0%) | |
| Slight or mild problem | 19 (42.2%) | 2 (4.8%) | 21 (24.1%) | |
| Moderate problem | 2 (4.4%) | 6 (14.3%) | 8 (9.2%) | |
| Severe problem | 5 (11.1%) | 33 (78.6%) | 38 (43.7%) |
Global assessment of pain (GAP);
Patient Self-report Survey for the Assessment of Fibromyalgia;
component 1 of Pittsburgh Sleep Quality Index (PSQI); BMI: body mass index; SD: standard deviation; N-Miss: no. of missing data points.
FMS patients had significantly higher pain scores, they were in pain for a higher proportion of their days, and they had more painful body sites than the controls. Cases were 2.9 times more likely to suffer from headaches (p-value: 0.023), 4.5 times more likely to suffer from abdominal cramps (p-value: 0.0008), and 5.3 times more likely to suffer from depression (p-value: 0.0005). Fatigue and poor sleep quality were more common among the cases. The detailed description of the study population is summarized in Table 1.
3.2. Assessment of immune cell subsets in fibromyalgia
We started with analyzing differential immunophenotypes of the PBMCs in FMS compared to matched cases in a hypothesis-free manner. Flow cytometry events were selected as shown in the Supplementary Figure 1A for the downstream analyses. No significant batch effects between flow cytometry runs were observed as there were no evident batch-specific cell clusters on the t-SNE plot (Supplementary Figure 1B). Neither the total cell count nor the cell viability differed between FMS cases and controls (t = 1.08, p-value = 0.12 and t = 0.87, p-value = 0.66; Supplementary Figure 1, C and D, respectively). Assignment of PBMC phenotypes was based on the presence of expression of various immunophenotypical markers (Supplementary Figures 2A–E).
With the available choice of markers, we were able to evaluate T helper lymphocytes (Th) subsets: Th1, Th2, Th17 and Tregs, T cytotoxic lymphocytes (Tc): Tc1, Tc2, and Tc17, B lymphocyte subsets: transitional, naïve, marginal zone, plasmablasts, and memory B cells, monocyte subsets: classical, intermediate and non-classical, dendritic cells (DCs): conventional DC and plasmacytoid DC, natural killer (NK) cell subsets: CD56bri, CD56dim, transitional, adaptive and terminal NK cells, and, natural killer-like T lymphocytes (NKT cells) subsets: CD4+ and CD8+ NKTs. The five flow cytometry panels, namely, Cyto panel, chemo panel, Treg panel, BMD panel, and NK panel had 10, 12, 11, 14, and 14 markers, respectively, apart from viability staining. To quantify novel immune cells, unsupervised gating strategies were implemented, which in theory, could explore 39,936 immune cell subsets. (with 10, 12, 11, 14 and 14 markers per panel, 210 + 212 + 211 + 214 + 214 marker combinations are possible.) Single cells across samples were projected into two dimensions using t-distributed UMAP for all the panels (Figure 2). Among all the PBMCs investigated, NK cell subsets were best able to differentiate FMS cases and controls (p-value < 10−4). Specifically, there were significantly fewer circulating CD56bri NK cells in FMS patients (Figure 2E), although both the major circulating NK cell subsets, CD56bri and CD56dim, were depleted in FMS. These findings were confirmed through a traditional manual gating approach (Supplementary Figures 3A–P for major immune cell subsets and Supplementary Figure 4 for NK cell counts and percentages).
Figure 2:
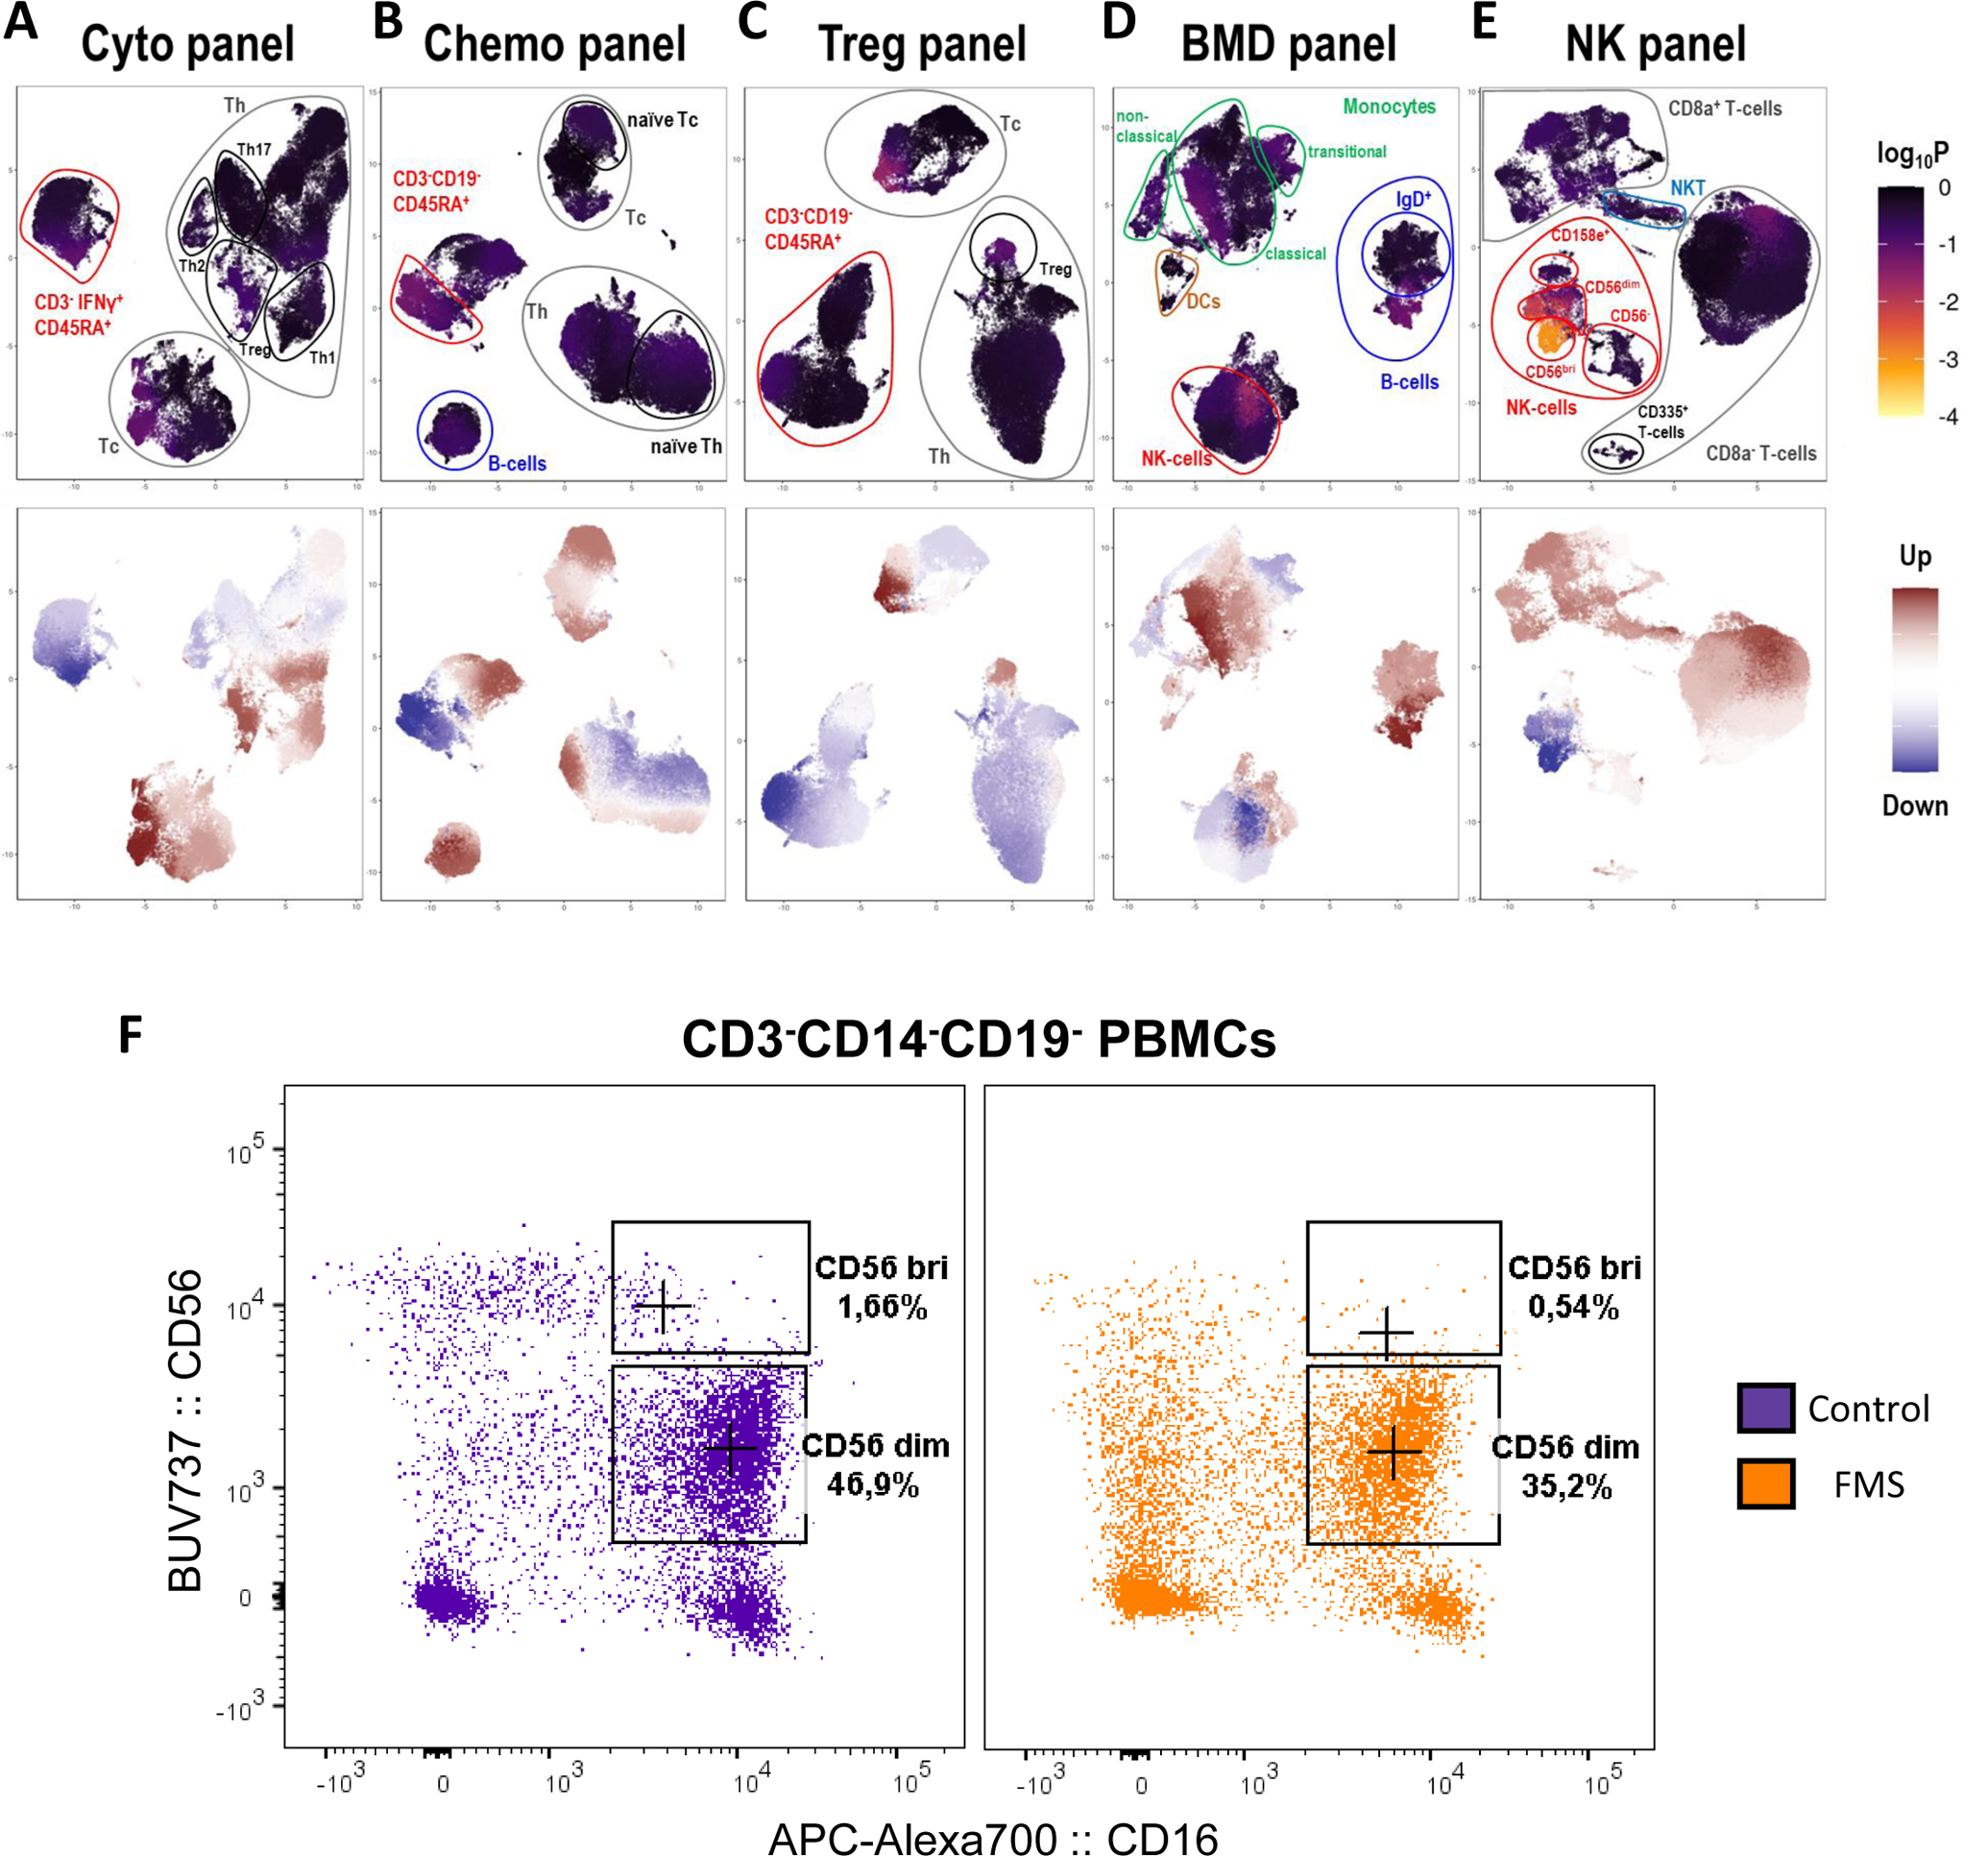
Differential abundance of immune cells in fibromyalgia syndrome (FMS). Single-cell data from the Cyto (A), Chemo (B), Treg (C), BMD (D), and the NK (E) flow cytometry panel were projected onto two dimensions using t-distributed UMAP. Cells were colored by their computed differentiation score, which depicts the degree of association with FMS, where the lighter the color, the more significant the association. The frequency differences between cases and controls are shown in the lower figure panels where red and blue represent increased and decreased frequencies in the cases, respectively. The p-values (displayed as log10P) were derived using the Wilcoxon Rank Sum test to quantify the extent of frequency differences between control and FMS groups. (F) Representative flow cytometry plots illustrating major NK cell subsets (CD56 bri and CD56 dim) between FMS case (yellow) and control (purple). Percentages represent the proportion of alive single CD3- CD14- CD19- cells
3.3. State of circulating NK cells in fibromyalgia
As depletion of circulating NK cells was associated with FMS, we examined a number of the surface markers on NK cells: CD16, CD107a, TIGIT, CD96, CD226, CD158e, CD159a, CD159c, and CD314. We observed differences between FMS patients and controls in the expression of CD16, CD107a, TIGIT, CD96, and CD226 with type I error < 5%. Specifically, circulating NK cells had decreased surface expression of resting NK cell markers, namely, CD16, CD96, and CD226, and, increased surface expression of degranulation marker, CD107a, and exhaustion marker, TIGIT (Figure 3), suggesting a hyperactive and exhausted state of circulating NK cells in FMS.
Figure 3:
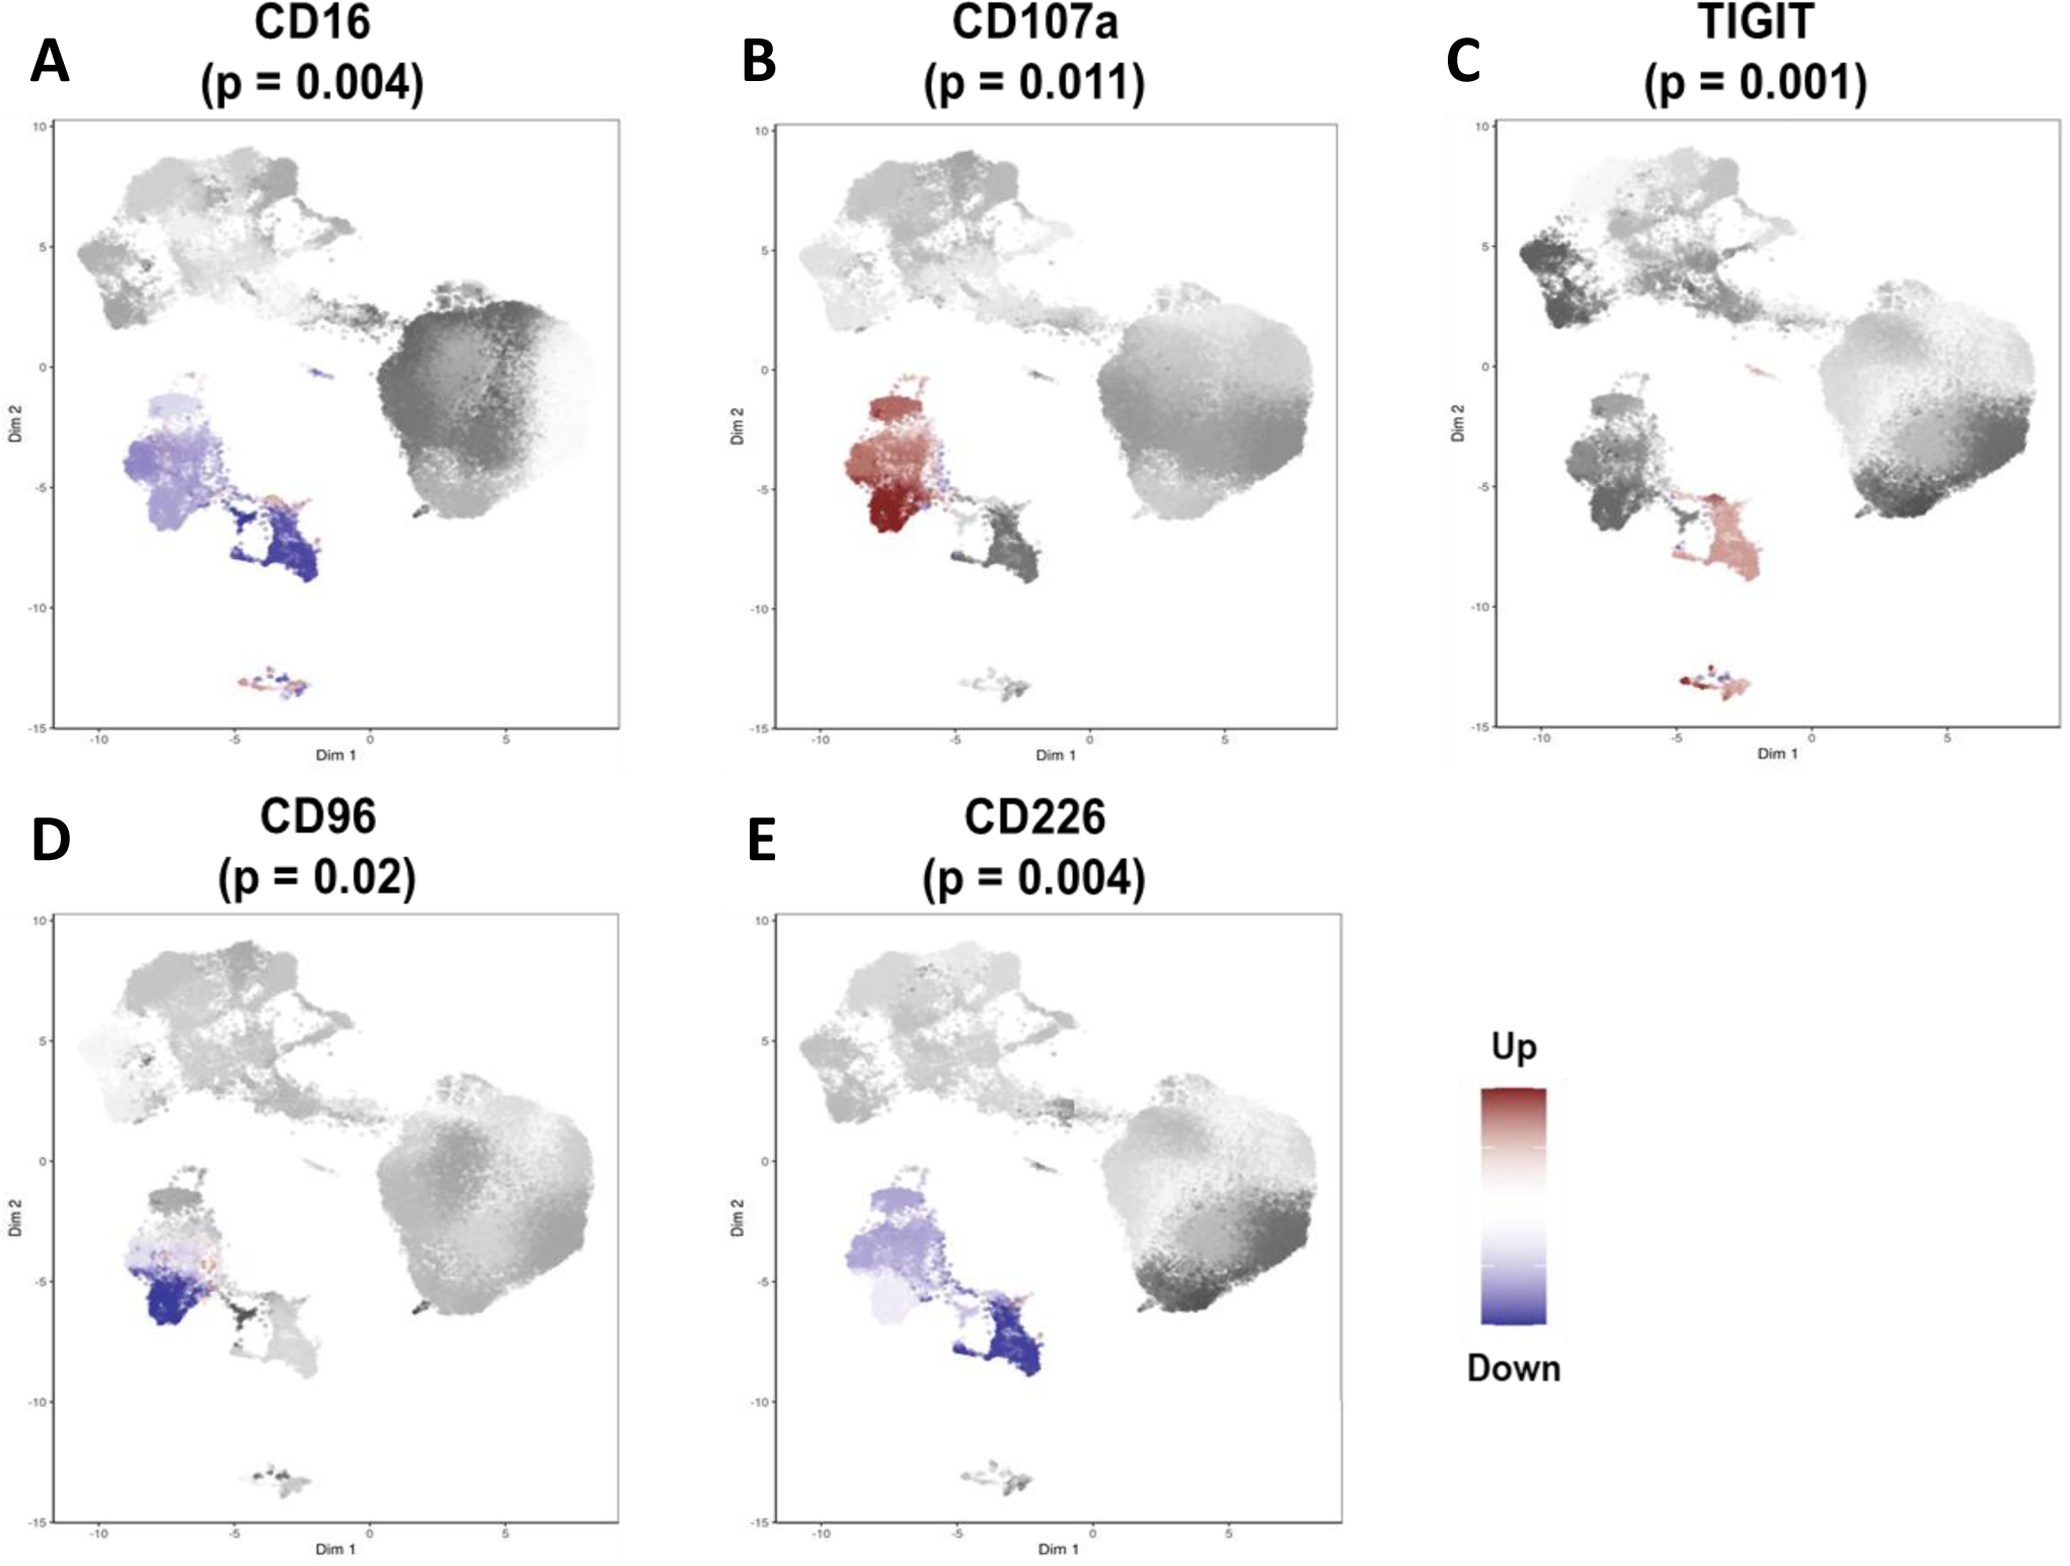
Differential states of natural killer (NK) cell subsets in fibromyalgia syndrome (FMS). The direction of differences in expression between case and control samples for CD16 (A), CD107a (B), TIGIT (C), CD96 (D), and CD226 (E). Red and blue represent increased and decreased expression in the cases, respectively. The p-values were derived using the Wilcoxon Rank Sum test to quantify the marker expression differences between control and FMS groups.
Next, we investigated whether the in-vitro activation profile of the circulating NK cells from FMS patients differed from that of the controls. NK cells were assessed for their capacity to respond to two distinct activating stimuli. Co-culturing with HLA−/− cells stimulates NK cells to reveal their direct functional cytotoxic potential, whereas, antibody-dependent NK cell activation (ADNKA) measures NK cell activation following incubation with antibody-bound target cells. Viable CD3−CD14−CD19−CD16+CD56+ cells were identified as NK cells for these assays (Supplementary Figure 5A). CCL4, CD107a, and IFNγ production were used as activation outcome measures. There were no differences in CCL4+, CD107a+ or IFNγ+ NK cells proportions between FMS cases and controls in unstimulated samples (t-stat = 1.33, 0.98 and 0.18, and, p-value = 0.19, 0.33 and 0.86 for CCL4+, CD107a+ and IFNγ+ NK cells, respectively; Supplementary Figure 5B). In contrast, NK cell activation after culture with HLA−/− cells revealed a significant increase in CCL4+ (β = 13.98, p-value = 0.02; Figure 4A) and CD107a+ (β = 17.04, p-value = 0.0006, Figure 4B) in NK cells from FMS patients compared to controls. IFNγ+ NK cells did not differ between FMS cases and controls (β = 0.13, p-value = 0.96, Figure 4C). A typical response of stimulated and unstimulated cells for CCL4, CD107a, and IFNγ production is shown in Supplementary Figure 5C. The ADNKA assay did not show statistically significant differences between cases and controls, although the trend of NK cell hyperactivity in FMS cases was still present as indicated by CCL4 and CD107a expression (β = 2.00, 10.27 and −1.63, and, p-value = 0.67, 0.10 and 0.55 for CCL4+, CD107a+ and IFNγ+ NK cells, respectively; Figures 4D–F).
Figure 4:
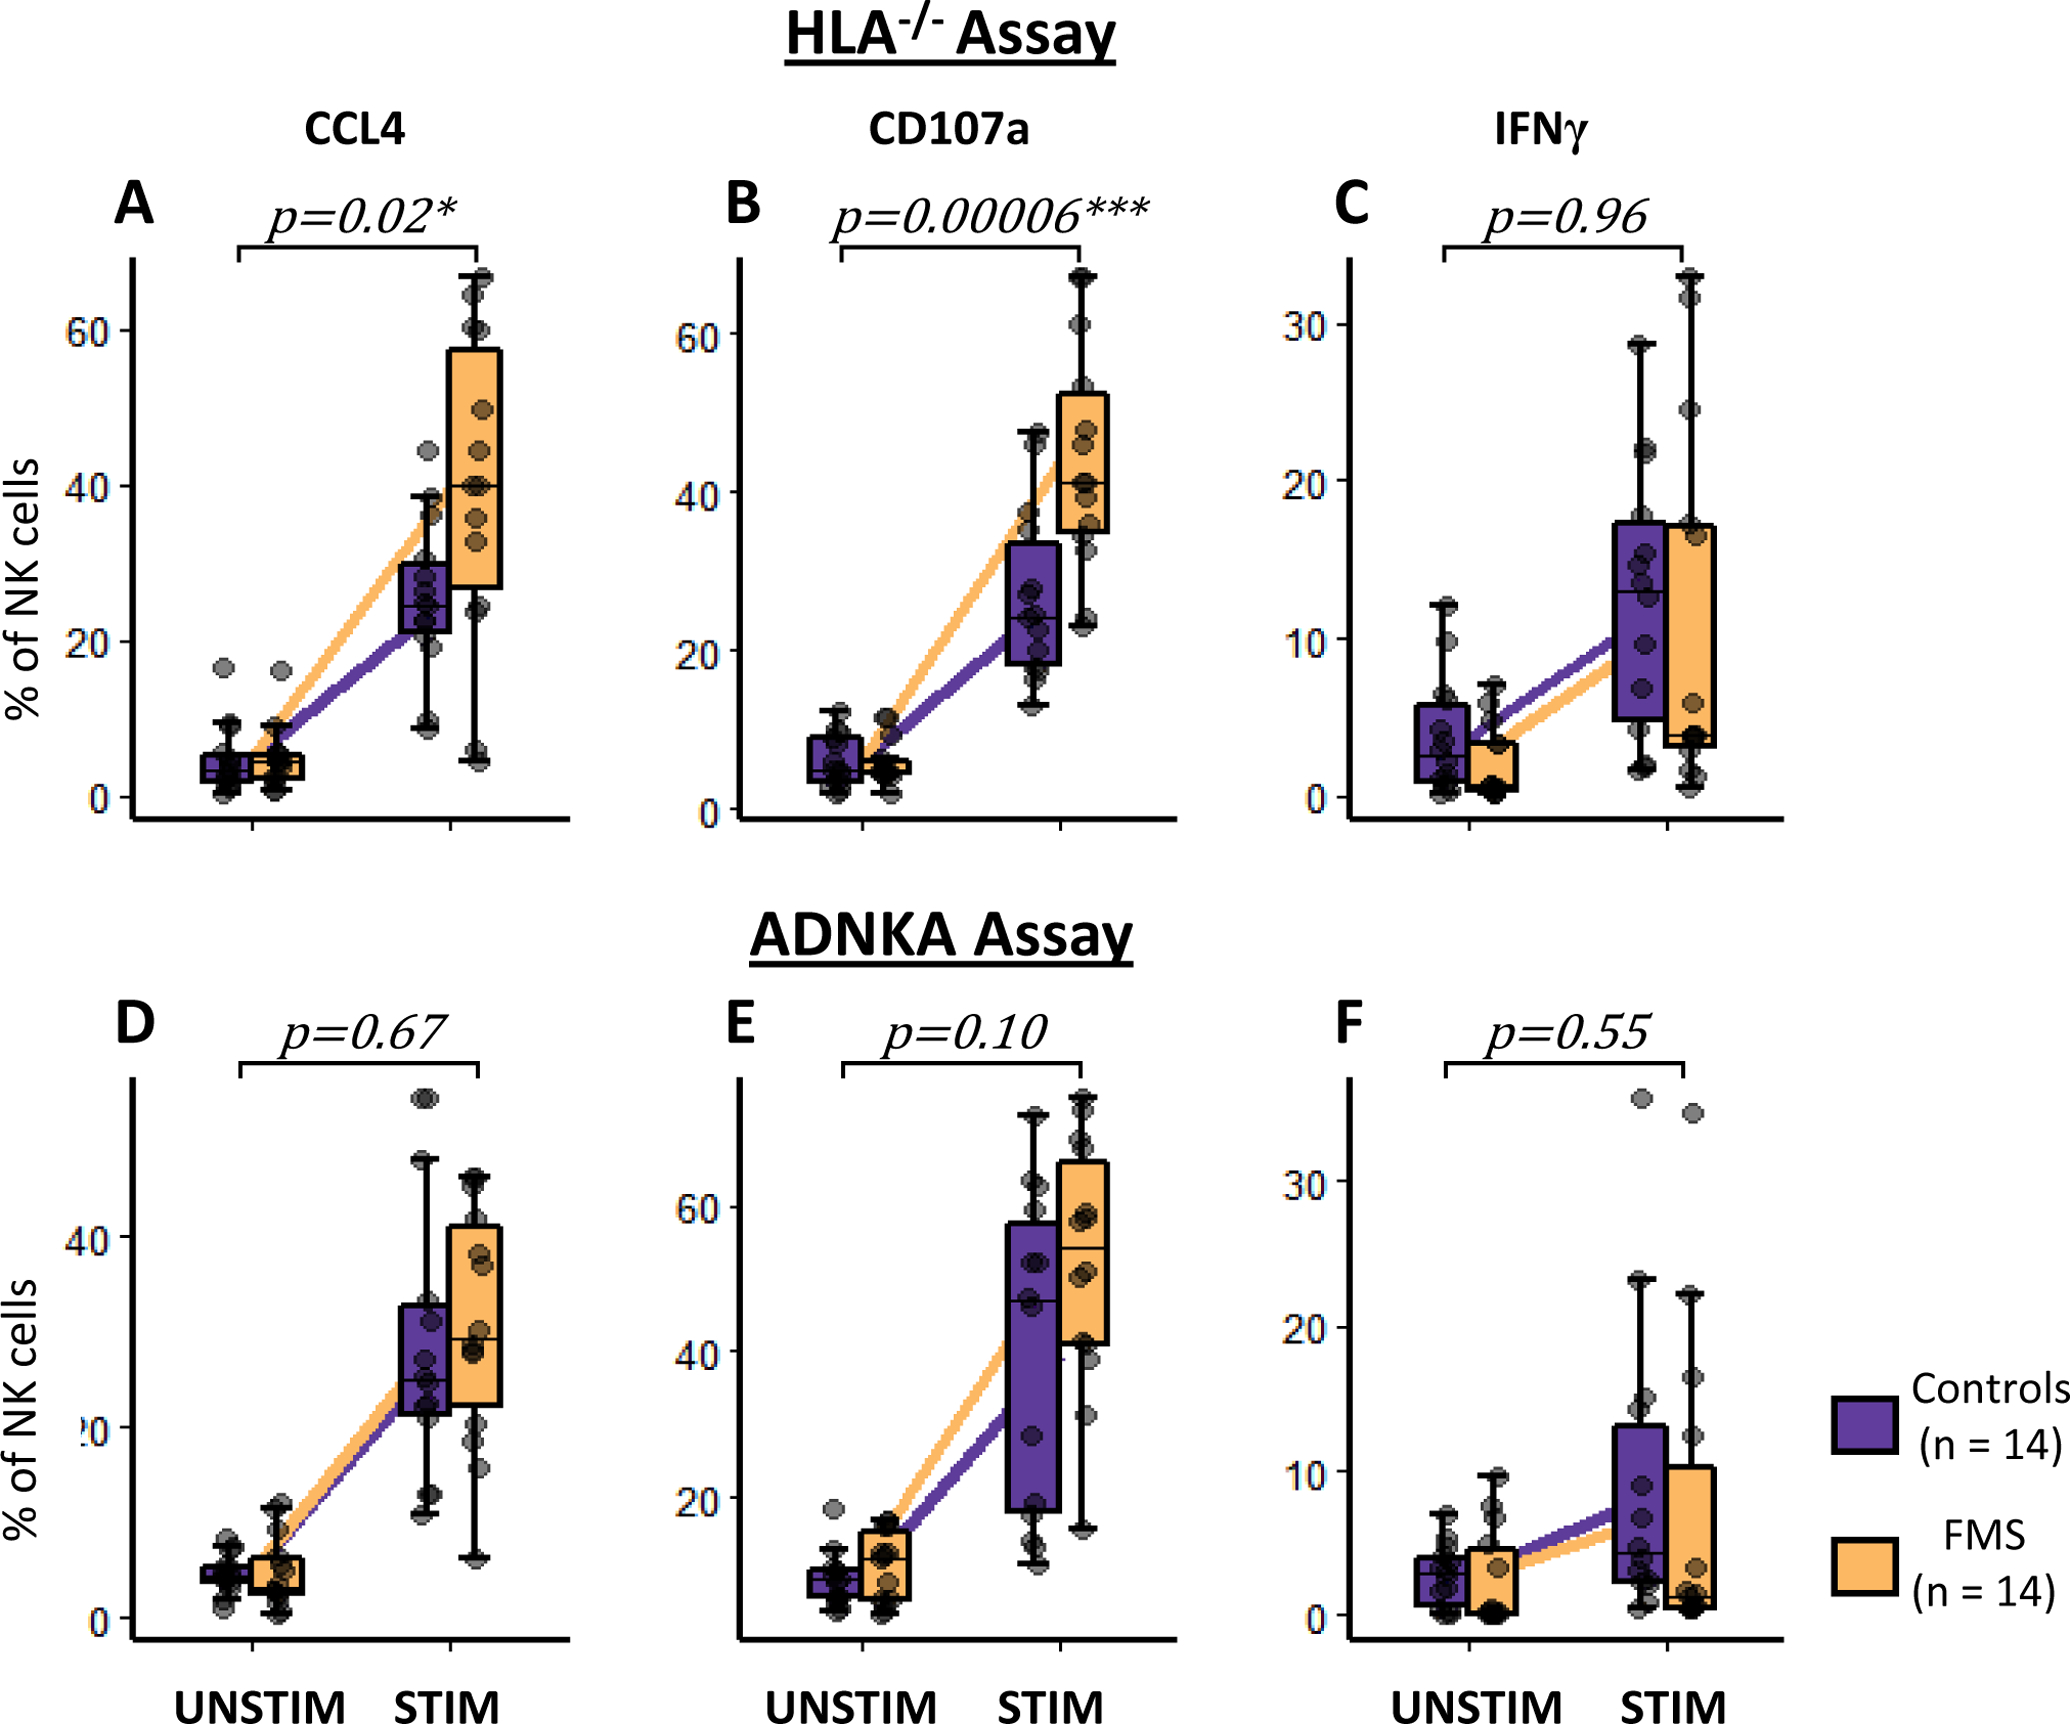
In-vitro natural killer (NK) cell activation in fibromyalgia syndrome (FMS) and control subjects. The NK cells were co-cultured with either Human Leukocyte Antigen null (HLA−/−) cell line (A, B, and C) or opsonized HIV+ cells (antibody-dependent NK activation, ADNKA assay, D, E, and F). Changes between unstimulated (UNSTIM) and stimulated (STIM) NK cells in the expression of NK activation markers, CCL4 (A and D), CD107a (B and E), and IFNγ (C and F) are shown. Purple and yellow boxplots represent controls and FMS cases, respectively. Whiskers represent the interquartile range and horizontal black lines represent group medians. Purple and yellow lines connect group means of controls and FMS cases, respectively. P-values represent the interaction term: condition x case-status of the mixed model with age, gender, and BMI as fixed effects, and, batch and sample ID as random effects. *p < 0.05 and ***p < 0.0001.
3.4. Enriched immune cell activation pathways in fibromyalgia
To corroborate our findings of circulating NK cell activation in FMS, we performed pathway analysis at transcriptomics and genetic levels. mRNA was extracted from the whole blood of FMS patients and controls of the Canadian cohort and subjected to next-generation sequencing (NGS). Pathway analysis was performed on the differentially expressed genes to test for enrichment of immune cell activation pathways. At the whole blood transcriptomics level, FMS subjects showed significant positive enrichment from the regulation of NK cell activation pathway (GO ID: 0032814, enrichment score = 0.5, FDR = 4%), but none of the other cell types crossed the FDR threshold of 10%. The leading-edge genes of this analysis were IL15, PIBF1, FLT3LG, CLNK, AXL, RHBDD3, TICAM1, TOX, GAS6, and BLOC1S3. We then repeated pathway analysis at the genetic level using summary statistics from the meta-analysis of GWAS results from the UKB and HUNT cohorts. FMS subjects showed significant enrichment for the NK cell activation pathway (GO ID: 0030101, FDR = 8%). The leading-edge genes of this analysis were CD2, IL2, BAG6, SP3, IFNB1, IFNA2, IFNA5, KLRK1, IL18, and IFNA14. In summary, pathway analyses revealed enrichment of NK cell activation and its regulation at genomics and transcriptomics levels. The results of pathway analyses are summarized in Figure 5.
Figure 5:
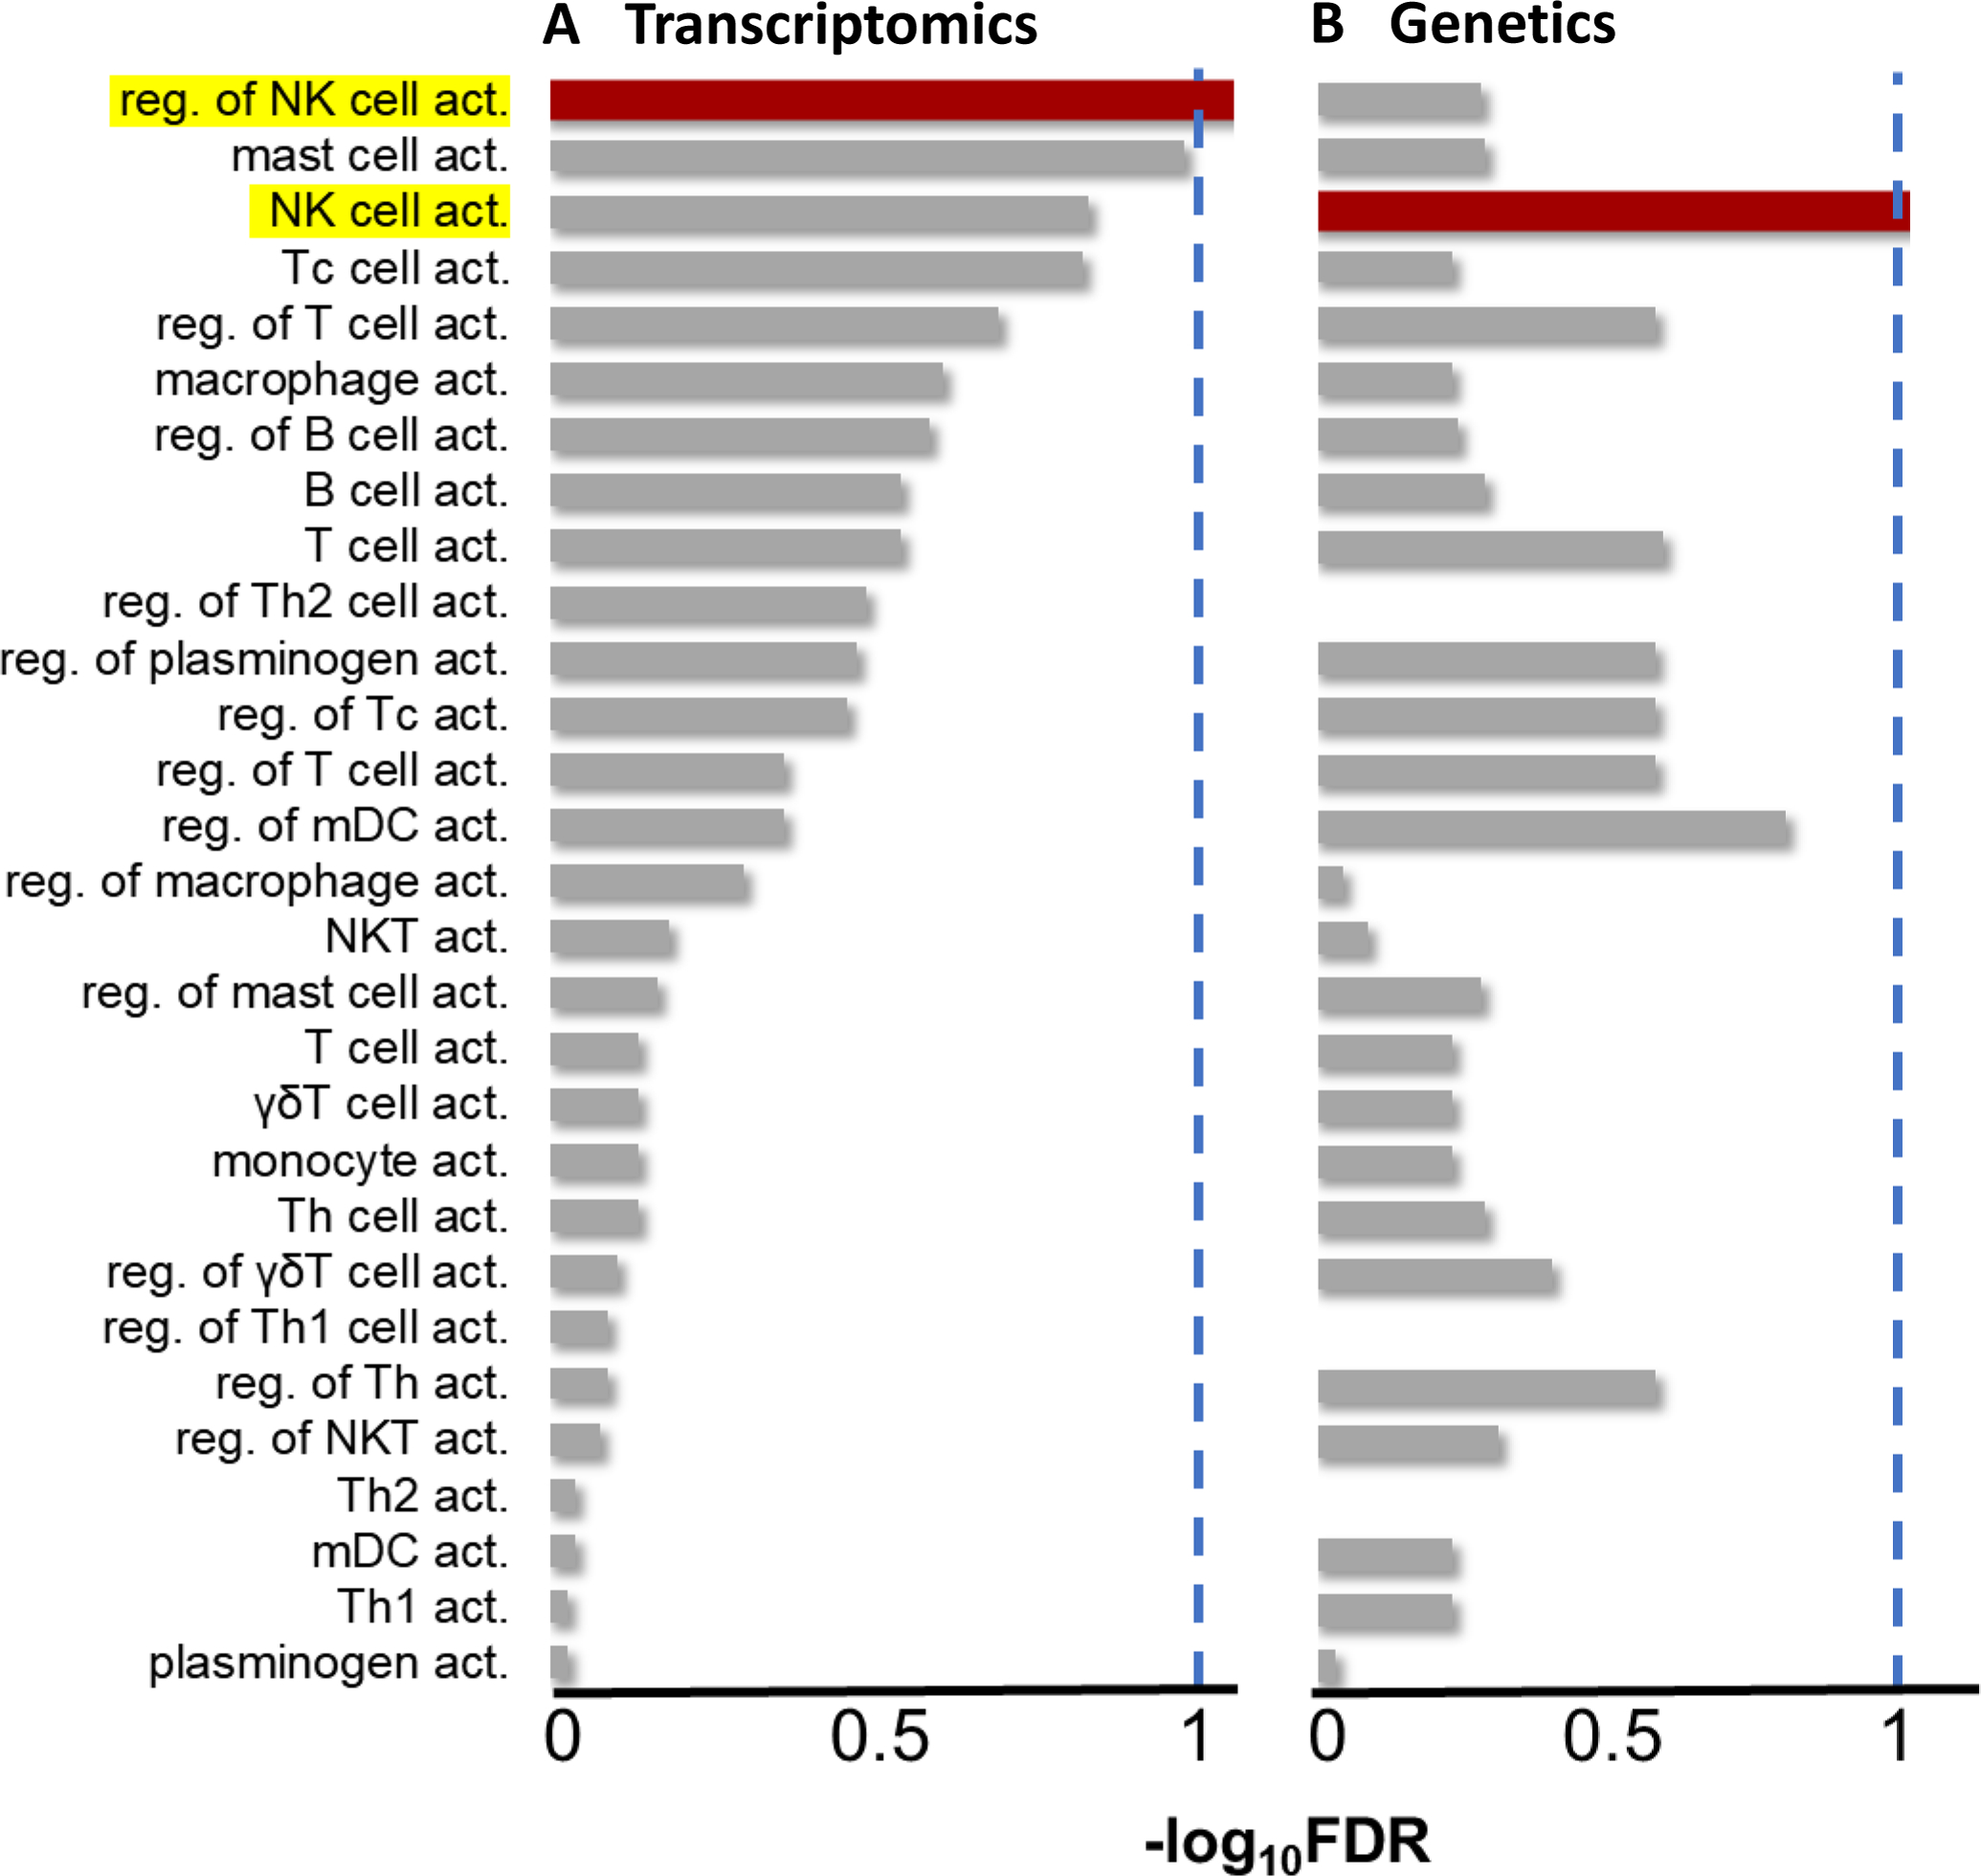
Enrichment of immune cell type activation pathways in fibromyalgia syndrome (FMS) patients compared to healthy controls. (A) Enrichment at the transcriptomics level, from RNA-seq data of whole blood from the Canadian cohort. (B) Enrichment at the genetics level, from the meta-analyzed genome-wide association studies in the UKB and the HUNT. Dashed blue lines represent FDR threshold of 10%. NK: natural killer; FDR: false discovery rate; reg.: regulation; act.: activation; Tc: cytotoxic T cells; Th: helper T cells; mDC: myeloid dendritic cells; NKT: NK-like T cells; γδ: gamma-delta; UKB: the UK biobank.
3.5. Peripheral recruitment of NK cells in fibromyalgia
We next investigated whether a decrease in circulating NK cells was a result of an overall reduction of NK cells in FMS patients or tissue redistribution. As NK cells can get recruited to damaged peripheral nerves[22] and a considerable number of FMS patients show reduced IENFD[29; 37; 64], we hypothesized that a decrease in circulating NK cells combined with an exhausted profile in the remaining population may be associated with their recruitment to and consequent degeneration of peripheral nerves in FMS patients. Using skin biopsies of FMS cases and matching controls from a cohort collected at the University of Würzburg, we found increased expression of the NK activation ligand, ULBP (ligand for CD314 or Natural killer group 2D, NKG2D, receptor) in the dermal nerve fibers of FMS patients (Figures 6A and B). Moreover, recruitment of NK cells (nucleated CD56+ cells) near dermal nerve fibers was seen predominantly in the skin biopsies of FMS patients but not in controls (Figure 6C and D). CD3 immunofluorescence was used to differentiate NK cells from T-lymphocytes, and no overlap between the stains was found (data not shown). Note that ULBP is also expressed by keratinocytes [41] (Figure 6A and B) and subepidermal nerves are expected to express CD56[71] (Figure 6C and D), which complicates the interpretation of images.
Figure 6:
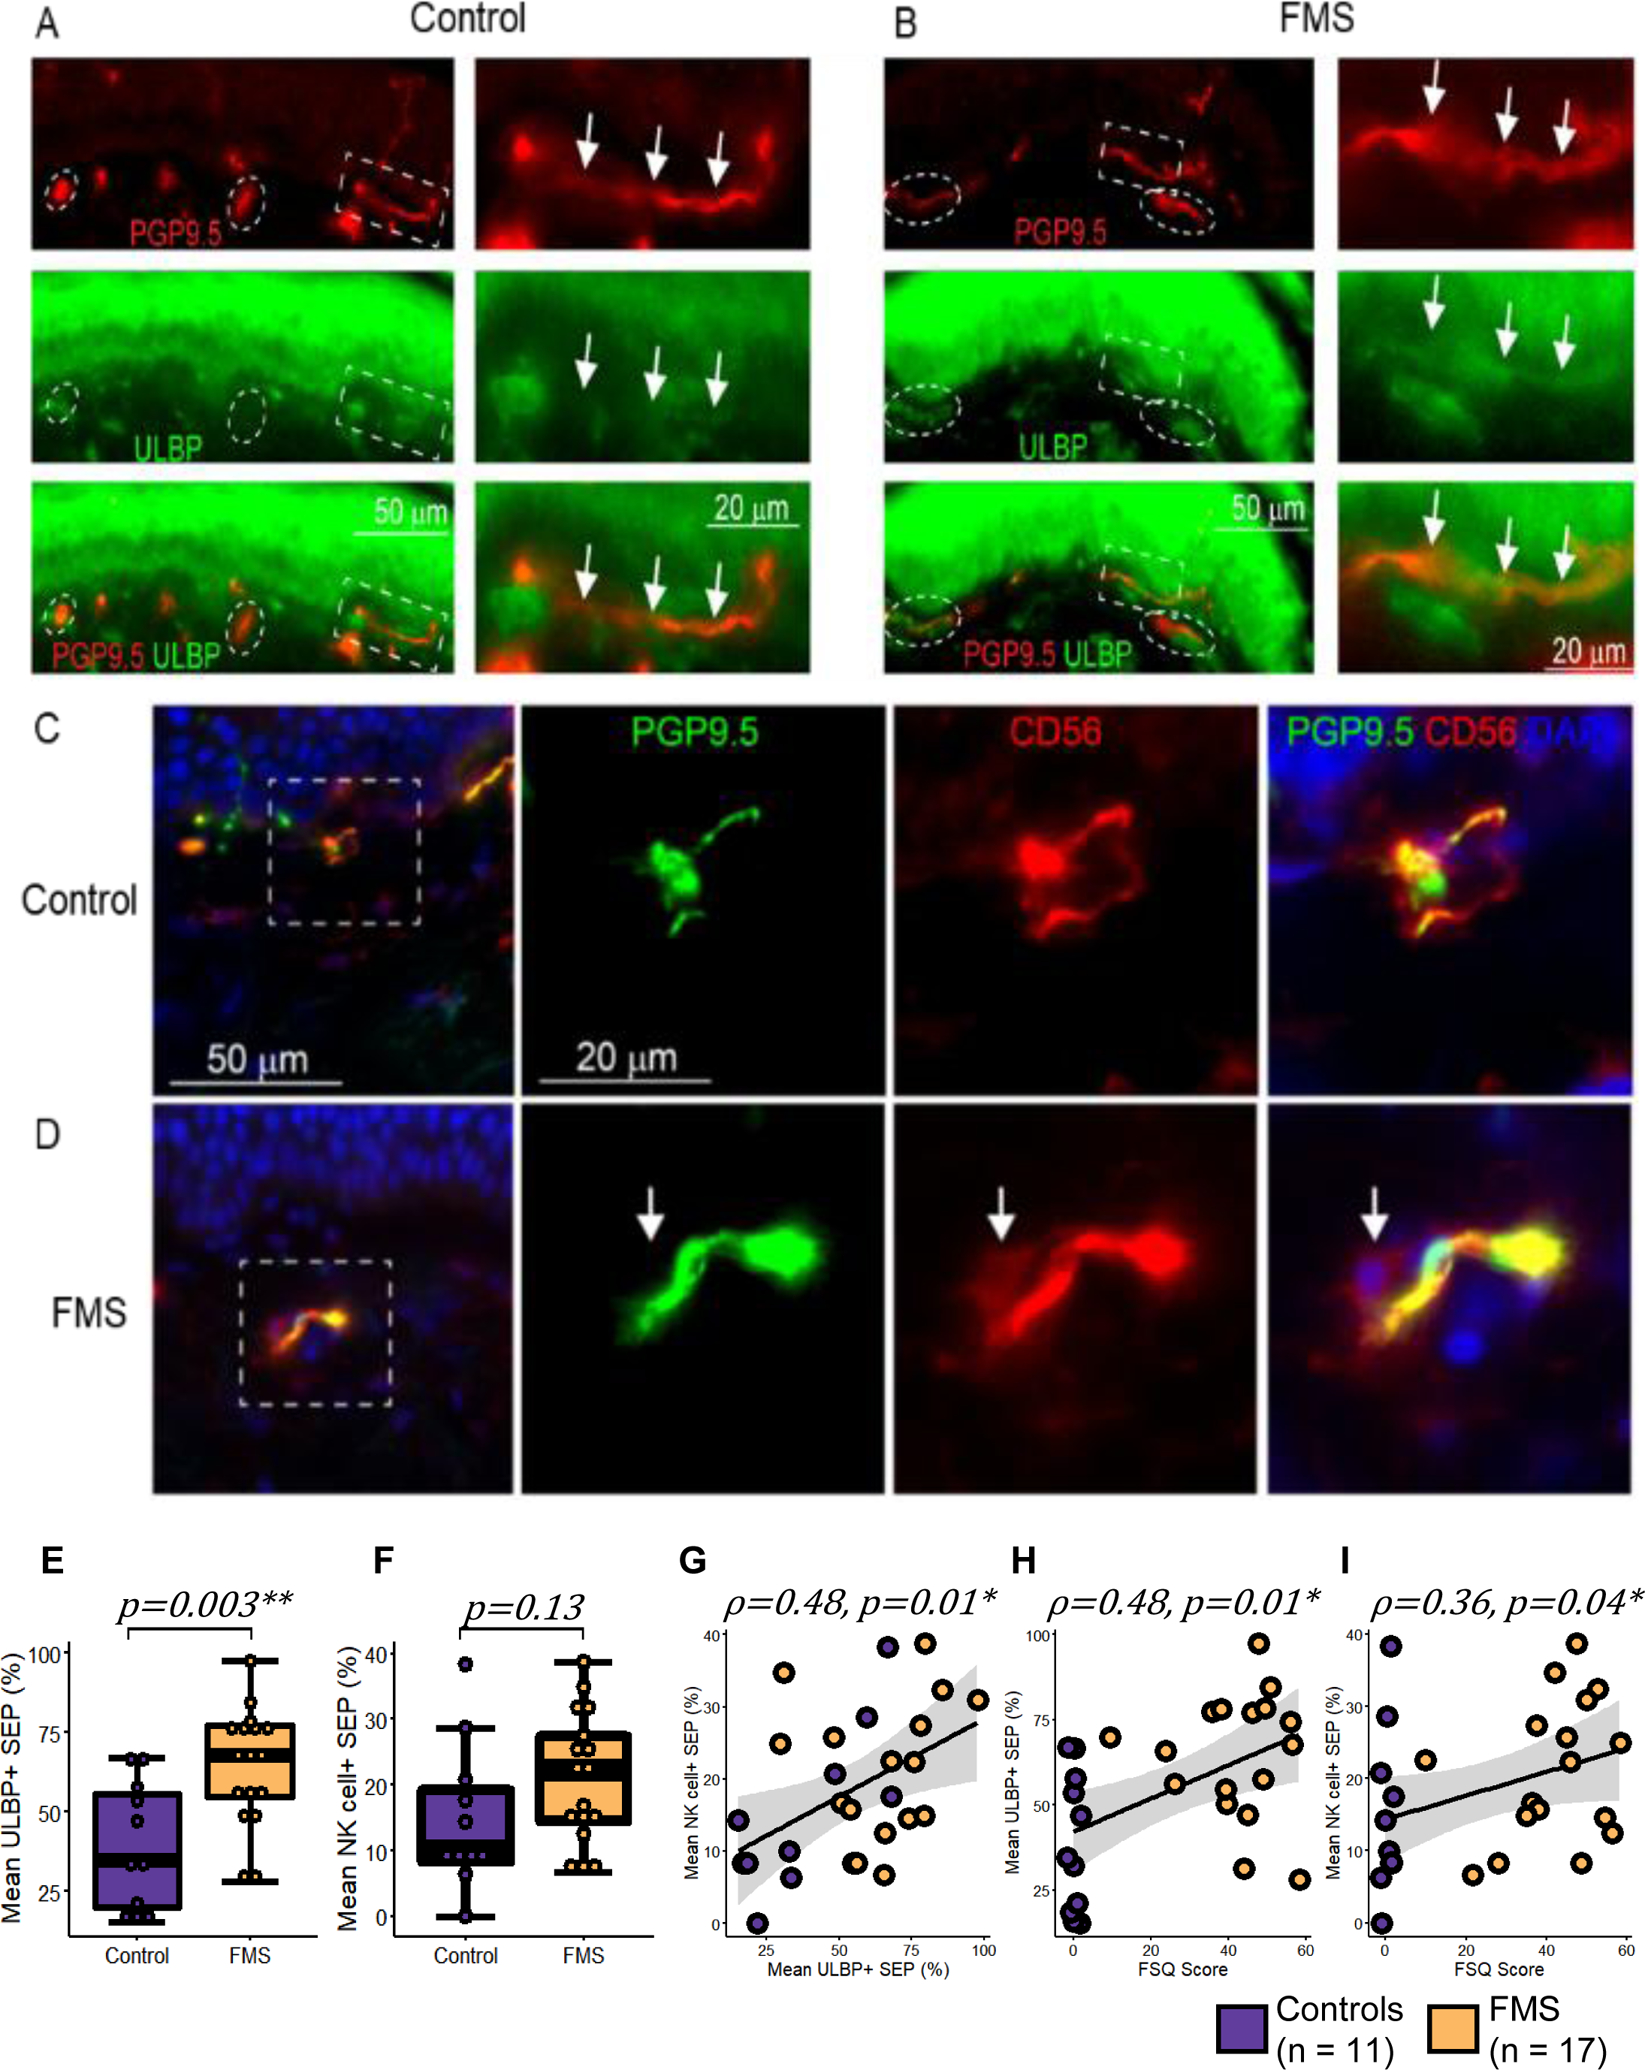
ULBP expression and NK cell recruitment at the dermal nerve fibers in fibromyalgia syndrome (FMS). (A, B) Representative immunostaining of the skin from (A) a control and (B) an FMS patient with nerve fibers stained with anti-PGP9.5 (red) and NK activation ligand stained with anti-ULBP (green). A high magnification image of the area in the white dashed box shows co-staining (marked with arrows) of PGP9.5 and ULBP in FMS but not in control. White dashed ovals show SEP. (C, D) Micro-images from a control (C) and an FMS patient (D) stained for PGP9.5 (green), nuclei (DAPI in blue), and CD56 (red). Arrows mark NK cells seen in the proximity of a SEP in FMS but not in controls. Boxplots showing the distribution of (E) ULBP+ SEP and (F) SEP with NK cells, stratified by case status. Whiskers represent the interquartile range and horizontal black lines represent group medians. (G-I) Correlation between (G) ULBP expression on SEP and NK cell recruitment at SEP; (H) ULBP expression on SEP and FSQ scores; (I) NK cell recruitment at SEP and FSQ scores. Purple and yellow depict controls (n=11) and FMS cases (n=17), respectively. Linear regression and its 95% confidence interval are shown as a black line and gray shaded area, respectively. P-values were calculated using Welch’s two-sample t-test and Spearman’s rank correlation. *p < 0.05 and **p < 0.01. FMS: fibromyalgia syndrome; ULBP: UL16 binding protein; SEP: Subepidermal plexus; NK: natural killer; FSQ: fibromyalgia survey questionnaire.
When evaluated quantitatively, we confirmed that there were significantly more ULBP+ SEP segments in FMS patients (Figure 6E, t = 3.4, p-value = 0.003). Interestingly, this increased ULBP expression in FMS was not associated with the diagnosis of IENF deficiency (p-value = 0.91, Supplementary Figure 6A). Although recruitment of NK cells was not significantly associated with the FMS case-status (Figure 6F, t = 1.6, p-value = 0.13), it correlated with neuronal ULBP expression (Figure 6G, ρ = 0.48, p-value = 0.01), Furthermore, both ULBP expression and NK cells requitement were correlated with the FSQ scores (Figure 6H, ρ = 0.48, p-value = 0.01; Figure 6I, ρ = 0.36, p-value = 0.04, respecttively).
4. Discussion
Multiple studies have reported alterations in several immune cell types in FMS in addition to nervous system contribution. [5; 8; 43–45; 61; 62; 70; 72] Although several mechanisms for the immunopathology of FMS have been proposed, no consensus has been reached. A recent meta-analysis showed upregulated immune-inflammatory and compensatory immune-regulatory systems in FMS, but, the precise involvement of the immune system in the pathophysiology of FMS is unclear.[3] Here, we employed a hypothesis-free, unbiased, multiparametric flow cytometry approach on PBMCs to evaluate immune cell subsets in a case-control manner. We found that the circulating NK cells display the strongest and most robust difference between the FMS cases and controls. Although both major circulating subsets of NK cells, CD56dim and CD56bri (Supplementary Figure 4C–D) were less frequent, our most significant finding was the depletion of CD56bri NK cells in FMS (t = −3.88, p-value = 0.0002). This subset of NK cells is known for its inflammatory and immune-regulatory functions.[49; 73] The CD56bri NK cell subset has also been shown to play a role in different disease states, such as cancer, neuroinflammation, and infection, and has been associated with tissue-specific recruitment in multiple autoimmune diseases.[34; 68] When the activation state of circulating NK cells was explored, we found that they expressed a unique signature in FMS patients characterized by decreased CD16 and higher CD107a and TIGIT expression compared to control samples. Similar to CD16 expression, CD226 (DNAX Accessory Molecule-1, DNAM-1) and CD96 (T Cell-Activated Increased Late Expression Protein, TACTILE) were decreased on the surface of the circulating NK cells. This phenotype is typically associated with a state of chronic activation and exhaustion in circulating NK cells.[42; 63; 76] Additionally, our in vitro studies indicated that NK cells from FMS patients were hyperresponsive. They produced more CCL4 (also known as macrophage inflammatory protein-1β, MIP-1β) and showed increased degranulation (as evident by increased CD107a expression) as compared to the NK cells from the controls when co-cultured with HLA−/− cells. By contrast, NK cells from FMS patients responded poorly to antibody-dependent signaling in an ADNKA assay. This may be related to the downmodulation of CD16 on NK cells from FMS cases as CD16 is the receptor for the Fc portion of antibodies and crucial in mediating antibody-dependent NK cell activation. Concordantly, pathway analyses of our RNA-seq transcriptomics data and GWAS-based genetic meta-analysis in two other independent cohorts confirmed enrichment for NK cell activation and its regulation profiles in FMS patients (Figure 5).
Due to the paucity of circulating NK cells, we questioned where the circulating NK cells could be redistributed and hypothesized that they could be recruited towards the peripheral nerves in FMS patients. This hypothesis was based on the high prevalence of small fiber neuropathy in FMS patients which ranges from 45–59%, depending on the methods used for determination[37; 64], and a variable degree of intraepidermal nerve fiber loss[84]. In humans, the NK activation receptor CD314 (alias, NKG2D) recognizes two families of major histocompatibility complex (MHC) I-like molecules, MHC I-related chain (MIC) A and B, and the ULBPs (1–6).[9] The expression of these ligands is restricted in normal tissues; however, infected, malignant, or stressed cells overexpress ULBPs, MICA, and MICB.[36] Although until recently virtually no studies were exploring the interaction of NK cells and peripheral nerves, extravasation of circulating NK cells and its recruitment have been recently shown to be associated with partially damaged peripheral nerves in mice.[22] In support of our hypothesis, we identified a higher expression of ULBP on the dermal nerve fibers of FMS patients from an independent cohort (Figure 6E). Furthermore, both higher expression of ULBP on and recruitment of NK cells to the dermal nerve fibers were significantly associated with FSQ score (Figure 6H, I). Additionally, we found that the recruitment of NK cells to the dermal nerve fibers of these patients correlated with ULBP expression (Figure 6G). Being derived from an independent FMS cohort, these results support our initial discovery and suggest a systemic re-distribution of NK cells from the circulation to the dermal nerve fibers in patients with FMS.
In line with these observations, decreased circulating NK cells have been reported previously in FMS[17; 50; 51] and in a related chronic fatigue syndrome (CFS) with tender points[69]. NK cells from FMS patients express more adhesion molecules, CD11b, and CD49d, compared to controls, that would promote their recruitment and/or retention at peripheral sites.[61] Furthermore, NK cell activity has been shown to correlate negatively with right hemisphere activity in the secondary somatosensory and motor cortices, thalamus, and bilaterally related to activity in the posterior cingulate cortex in FMS.[54] Decreased numbers of circulating NK cells also has been reported in other chronic pain conditions such as chronic lower back pain[10; 21; 85], cluster headache[13] and vulvar vestibulitis[66]. Thus, redistribution of NK cells may be a general mechanism in chronic pain conditions.
Combining our results with previous studies, we propose a new heuristic model of the immunopathology of FMS (Figure 7). According to our model, in FMS, peripheral nerves chronically express NK activation ligand(s), leading to the extravasation and peripheral recruitment of circulating NK cells. This extravasation leads to a reduced number of circulating NK cells in the blood. Notably, ULBP expression on the intraepidermal nerve fibers is associated with FMS irrespective of IENF deficiency (Supplementary Figure 6A) and there is only a weak anti-correlation between ULBP expression and IENF density (ρ = −0.35, p-value = 0.07, Supplementary Figure 6G). However, because of the significant association of ULBP expression with FMS severity (ρ = 0.48, p-value = 0.01, Figure 6H), it is possible that in some FMS patients even when the nerves are being marked by ULBP for removal by NK cells, they continue to regrow, masking IENF deficiency but not preventing pain symptoms. Alternatively, nerve damage and regrowth could be taking place periodically, thus explaining the waxing and waning nature of FMS symptoms.[1] Nonetheless, the site of this neuroimmune interaction between NK cells and dermal nerve fibers could justify some of the dermatological manifestations of FMS[52] such as lichen simplex chronicus, neurotic excoriations, prurigo nodules, pruritus, burning sensations, and hyperhidrosis. It is unclear if ULBP expression on the peripheral nerves is a cause, consequence, or exacerbator of the nerve damage in FMS. Also, we do not know if ULBP is the only NK-activation ligand expressed by the peripheral nerves in FMS. Alternatively, FMS could be a manifestation of increased genetic predisposition of NK cells for overactivation (Figure 5B) which then leads to peripheral nerve damage and enhanced ULBP expression, triggering a vicious cycle.
Figure 7:
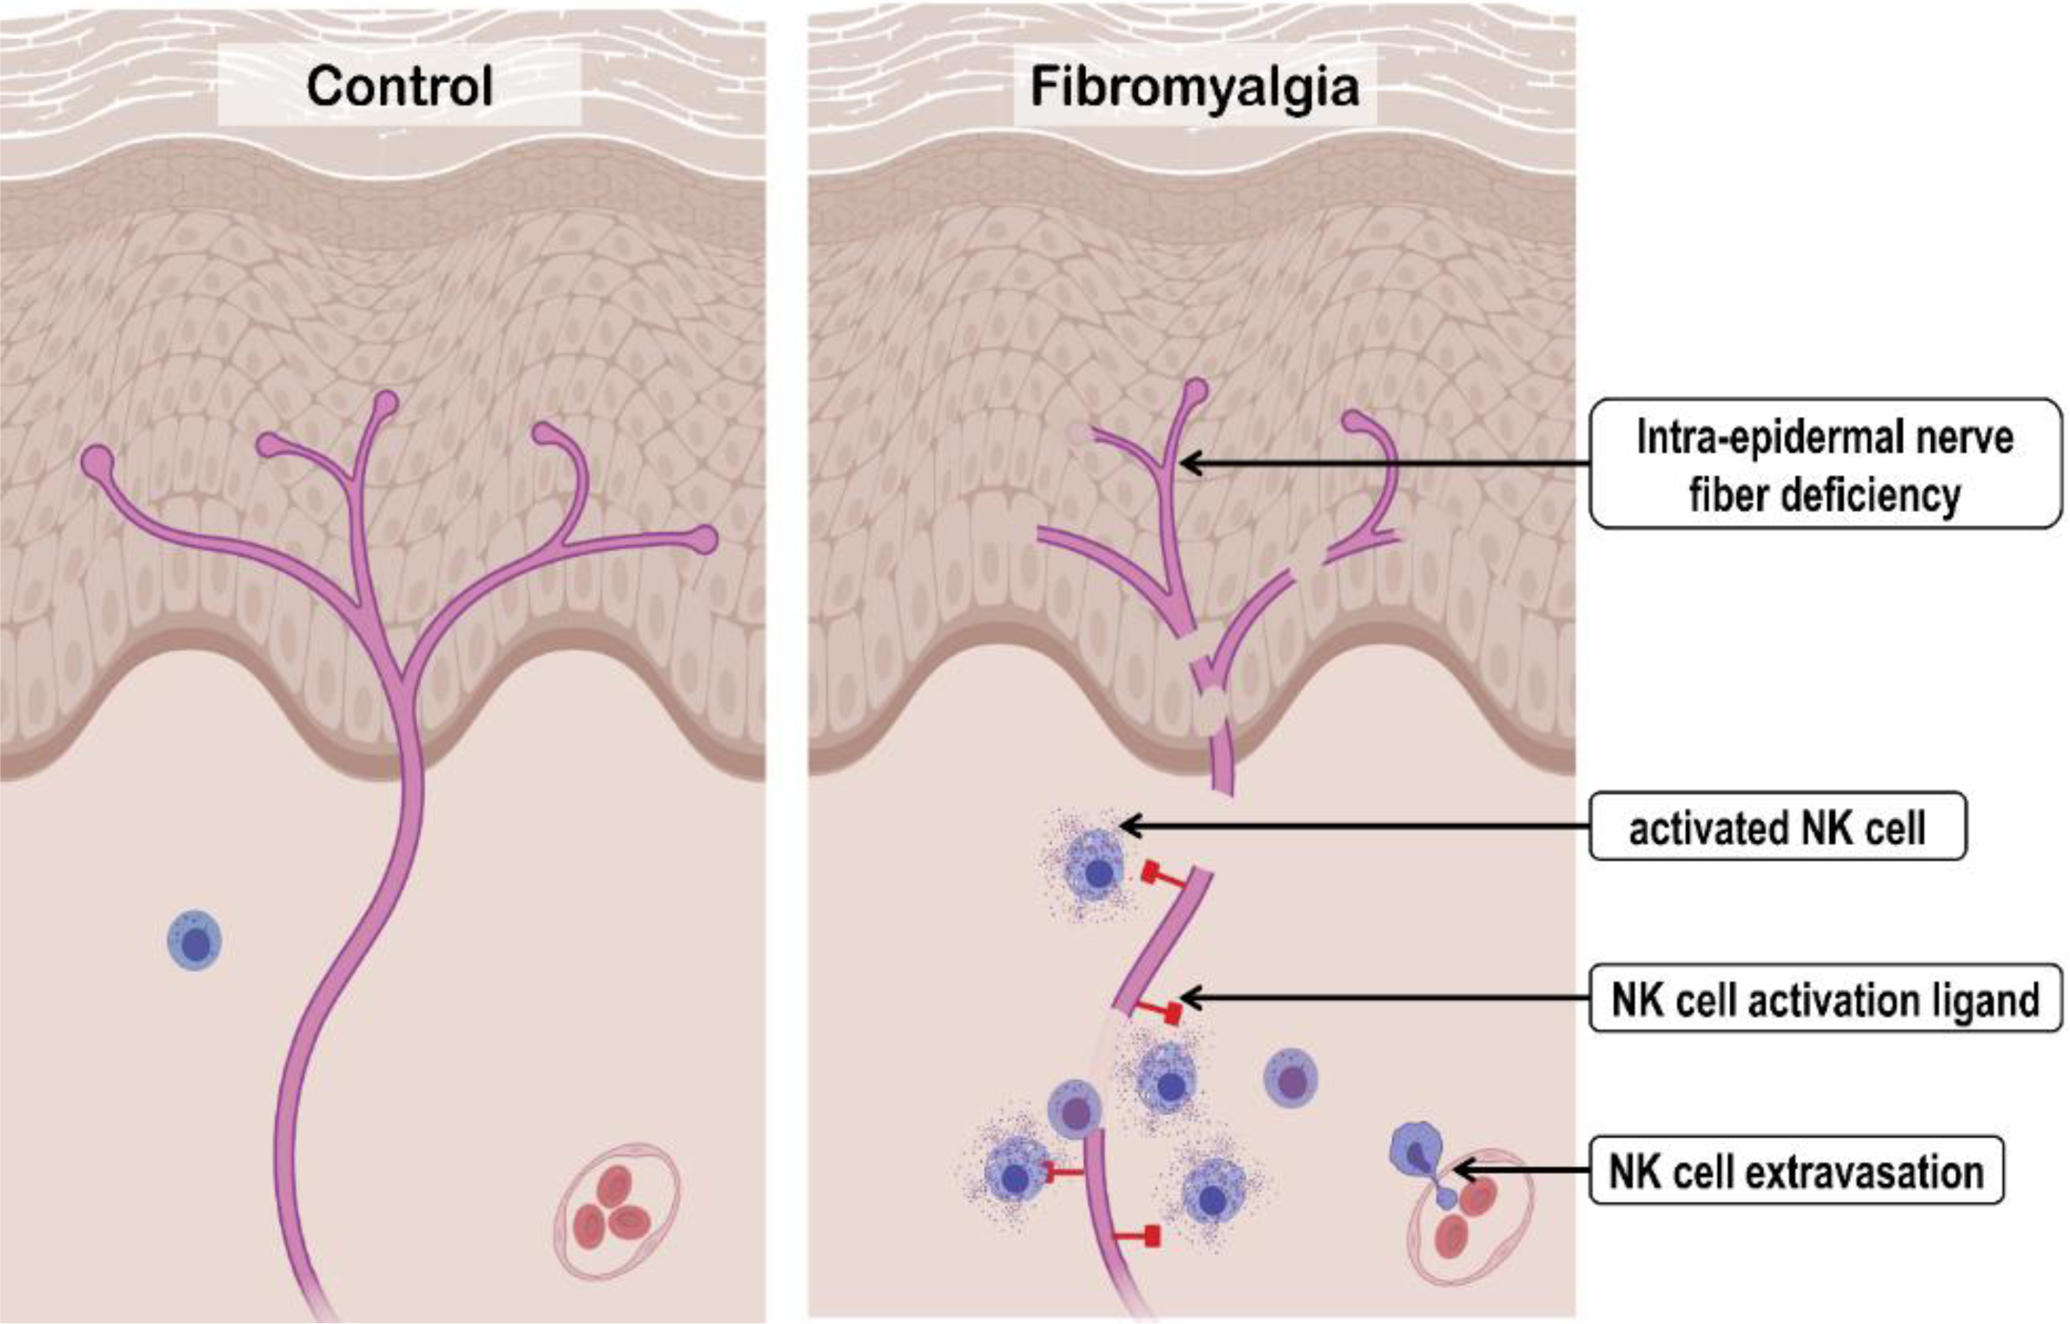
Heuristic model of natural killer (NK) cells’ contribution to fibromyalgia syndrome (FMS) pathogenesis. Compared to controls, FMS patients express the natural killer (NK) activation ligand(s) on the peripheral nerves. This promotes extravasation, recruitment, and activation of the circulated NK cells with subsequent chronic degeneration of the peripheral nerve. (Created with BioRender.com.)
Usually, the expression of NK activation ligands is a signal of cell stress and damage, such as response to viral infections[94] or injury[23], and their expression triggers selective destruction of the marked cells. The cause of NK activation ligand (ULBP) expression on the dermal nerve fibers of FMS patients is unknown and will require further investigation. But at least two mechanisms can be proposed. First, there is evidence that viral infections can trigger FMS and CFS.[12] Thus, a chronic or latent viral infection of sensory neurons may lead to the expression of ULBP on the peripheral nerves of FMS patients. The other possibility is related to the recently identified autoimmune mechanisms contributing to FMS through IgG autoantibodies that sensitize peripheral sensory neurons in FMS patients.[35] This sensitization can also lead to NK activation ligand expression on the sensory neurons. There are substantial similarities between FMS and other autoimmune diseases[67] and NK cells play multiple crucial roles in linking innate and adaptive immune responses to either promote or protect against the onset of autoimmune conditions. Decreased numbers of circulating NK cells are reported in autoimmune patients and this alteration has been linked to their trafficking to damaged tissues[34]. Both, activation and exhaustion of circulating NK cells have been reported in various chronic inflammatory conditions such as chronic infections, malignancies, and autoimmune disorders.[86] Hyperactivation of NK cells has been also reported in multiple autoimmune diseases.[34] Nevertheless, the most important piece of this puzzle, the initial stimulus for immune cell activation in FMS remains to be discovered.
It is important to stress that although our findings show an association between NK cells and FMS, it does not exclude the possibility that other immune cell types could also contribute to this condition in a consequent, inter-dependent, or independent manner. Our flow cytometry, genetics, and, transcriptomics data support immune dysregulation in FMS where NK cells-neuroimmune interaction could be a partial explanation for FMS immunopathology. Importantly, the contribution of multiple immune cells to chronic inflammation that drives neurodegeneration has been reported,[90] whereas, the potential role of NK cells in neurodegeneration and pain modulation has only recently been recognized in an animal model.[22] Hence, exploring the immune system using holistic approaches such as immune cell profiling with mass cytometry and single-cell RNA sequencing in FMS over the course of disease development are needed to further explore the immune system’s involvement in FMS. Similarly, the causes of NK activation ligand expression by the dermal nerve fibers in FMS warrants further examination.
To conclude, this study identified a neuro-immune interface between peripheral nerves and NK cells in FMS patients that suggests a novel mechanism for FMS pathogenesis and a new direction in the development of therapeutic options to treat this poorly managed syndrome.
Supplementary Material
6. Acknowledgments
We would like to express our gratitude towards the research participants and members of the Association de Fibromyalgie du Quebec. We acknowledge critical support and expert technical assistance from the RI-MUHC, REDCap team, flow cytometry facility of McGill University, and RI-MUHC immunophenotyping platforms, the clinical research staff of RI-MUHC and AECRP, and, Tsoarello Mabanga. We would like to thank Dr. Sonia Néron, Dr. Megan Levings, and Dr. Natalie Stanley for their consultation. This work was supported by Canadian Excellence Research Chairs (CERC) program, (Grant number: CERC09), a Pfizer Canada Professorship in Pain Research, CIHR (SCA-145102) for Health Research’s Strategy for Patient-Oriented Research (SPOR) in Chronic Pain, and NIH/NIDCR Grant # U01DE017018 to LD, and, by an unrestricted grant from the Else Kröner-Fresenius-Stiftung to NÜ (2014_A129). ANÖA was supported by the European Academy of Neurology (EAN) Clinical Fellowship Programme 2020 in the laboratory of CS. CS acknowledges grant support from Interdisziplinäres Zentrum für Klinische Forschung (IZKF, F-N-376). CIS acknowledges funding from the European Research Council (ERC) under the Horizon 2020 research and innovation programme (Grant agreement No. 866075), the Swedish Research Council (Grant No. 542-2013-8373) and the Knut and Alice Wallenberg Foundation. EK reports the CIHR postdoctoral fellowship (MFE-171299). The Trøndelag Health Study (HUNT) is a collaboration between HUNT Research Centre (Faculty of Medicine and Health Sciences, Norwegian University of Science and Technology NTNU), Trøndelag County Council, Central Norway Regional Health Authority, and the Norwegian Institute of Public Health. The genotyping for HUNT study was financed by the National Institute of health (NIH), University of Michigan, The Norwegian Research council, and Central Norway Regional Health Authority and the Faculty of Medicine and Health Sciences, Norwegian University of Science and Technology (NTNU). The genotype quality control and imputation has been conducted by the K.G. Jebsen center for genetic epidemiology, Department of public health and nursing, Faculty of medicine and health sciences, Norwegian University of Science and Technology (NTNU).
Footnotes
Conflict of interest statement
The authors have no conflicts of interest to declare.
7. References
- [1].Adams EH, McElroy HJ, Udall M, Masters ET, Mann RM, Schaefer CP, Cappelleri JC, Clair AG, Hopps M, Daniel SR, Mease P, Silverman SL, Staud R. Progression of fibromyalgia: results from a 2-year observational fibromyalgia and chronic pain study in the US. J Pain Res 2016;9:325–336. [DOI] [PMC free article] [PubMed] [Google Scholar]
- [2].Allen NE, Sudlow C, Peakman T, Collins R, Biobank UK. UK biobank data: come and get it. Sci Transl Med 2014;6(224):224ed224. [DOI] [PubMed] [Google Scholar]
- [3].Andres-Rodriguez L, Borras X, Feliu-Soler A, Perez-Aranda A, Angarita-Osorio N, Moreno-Peral P, Montero-Marin J, Garcia-Campayo J, Carvalho AF, Maes M, Luciano JV. Peripheral immune aberrations in fibromyalgia: A systematic review, meta-analysis and meta-regression. Brain Behav Immun 2020;87:881–889. [DOI] [PubMed] [Google Scholar]
- [4].Arnold LM, Bennett RM, Crofford LJ, Dean LE, Clauw DJ, Goldenberg DL, Fitzcharles MA, Paiva ES, Staud R, Sarzi-Puttini P, Buskila D, Macfarlane GJ. AAPT Diagnostic Criteria for Fibromyalgia. J Pain 2019;20(6):611–628. [DOI] [PubMed] [Google Scholar]
- [5].Banfi G, Diani M, Pigatto PD, Reali E. T Cell Subpopulations in the Physiopathology of Fibromyalgia: Evidence and Perspectives. Int J Mol Sci 2020;21(4). [DOI] [PMC free article] [PubMed] [Google Scholar]
- [6].Baraniuk JN, Clauw D, Yuta A, Ali M, Gaumond E, Upadhyayula N, Fujita K, Shimizu T. Nasal secretion analysis in allergic rhinitis, cystic fibrosis, and nonallergic fibromyalgia/chronic fatigue syndrome subjects. Am J Rhinol 1998;12(6):435–440. [DOI] [PubMed] [Google Scholar]
- [7].Baraniuk JN, Zheng Y. Relationships among rhinitis, fibromyalgia, and chronic fatigue. Allergy Asthma Proc 2010;31(3):169–178. [DOI] [PubMed] [Google Scholar]
- [8].Behm FG, Gavin IM, Karpenko O, Lindgren V, Gaitonde S, Gashkoff PA, Gillis BS. Unique immunologic patterns in fibromyalgia. BMC Clin Pathol 2012;12:25. [DOI] [PMC free article] [PubMed] [Google Scholar]
- [9].Bottino C, Castriconi R, Moretta L, Moretta A. Cellular ligands of activating NK receptors. Trends Immunol 2005;26(4):221–226. [DOI] [PubMed] [Google Scholar]
- [10].Brennan PC, Graham MA, Triano JJ, Hondras MA, Anderson RJ. Lymphocyte profiles in patients with chronic low back pain enrolled in a clinical trial. J Manipulative Physiol Ther 1994;17(4):219–227. [PubMed] [Google Scholar]
- [11].Brummelman J, Haftmann C, Nunez NG, Alvisi G, Mazza EMC, Becher B, Lugli E. Development, application and computational analysis of high-dimensional fluorescent antibody panels for single-cell flow cytometry. Nat Protoc 2019;14(7):1946–1969. [DOI] [PubMed] [Google Scholar]
- [12].Fibromyalgia Buskila D., chronic fatigue syndrome, and myofascial pain syndrome. Curr Opin Rheumatol 2001;13(2):117–127. [DOI] [PubMed] [Google Scholar]
- [13].Bussone G, Salmaggi A, Leone M, Valentini S, Dufour A, Nespolo A. Immunological alterations in cluster headache during remission and cluster period. Comparison with low back pain patients. Cephalalgia 1992;12(4):250–253. [DOI] [PubMed] [Google Scholar]
- [14].Cagnie B, Coppieters I, Denecker S, Six J, Danneels L, Meeus M. Central sensitization in fibromyalgia? A systematic review on structural and functional brain MRI. Seminars in Arthritis and Rheumatism 2014;44(1):68–75. [DOI] [PubMed] [Google Scholar]
- [15].Caro XJ, Galbraith RG, Winter EF. Evidence of peripheral large nerve involvement in fibromyalgia: a retrospective review of EMG and nerve conduction findings in 55 FM subjects. Eur J Rheumatol 2018;5(2):104–110. [DOI] [PMC free article] [PubMed] [Google Scholar]
- [16].Caro XJ, Winter EF. Evidence of abnormal epidermal nerve fiber density in fibromyalgia: clinical and immunologic implications. Arthritis Rheumatol 2014;66(7):1945–1954. [DOI] [PubMed] [Google Scholar]
- [17].Carvalho LS, Correa H, Silva GC, Campos FS, Baiao FR, Ribeiro LS, Faria AM, d’Avila Reis D. May genetic factors in fibromyalgia help to identify patients with differentially altered frequencies of immune cells? Clin Exp Immunol 2008;154(3):346–352. [DOI] [PMC free article] [PubMed] [Google Scholar]
- [18].Clauw DJ. Fibromyalgia: a clinical review. JAMA 2014;311(15):1547–1555. [DOI] [PubMed] [Google Scholar]
- [19].Clauw DJ. Fibromyalgia and related conditions. Mayo Clin Proc 2015;90(5):680–692. [DOI] [PubMed] [Google Scholar]
- [20].Creed F A review of the incidence and risk factors for fibromyalgia and chronic widespread pain in population-based studies. Pain 2020;161(6):1169–1176. [DOI] [PubMed] [Google Scholar]
- [21].Das B, Conroy M, Moore D, Lysaght J, McCrory C. Human dorsal root ganglion pulsed radiofrequency treatment modulates cerebrospinal fluid lymphocytes and neuroinflammatory markers in chronic radicular pain. Brain Behav Immun 2018;70:157–165. [DOI] [PubMed] [Google Scholar]
- [22].Davies AJ, Kim HW, Gonzalez-Cano R, Choi J, Back SK, Roh SE, Johnson E, Gabriac M, Kim MS, Lee J, Lee JE, Kim YS, Bae YC, Kim SJ, Lee KM, Na HS, Riva P, Latremoliere A, Rinaldi S, Ugolini S, Costigan M, Oh SB. Natural Killer Cells Degenerate Intact Sensory Afferents following Nerve Injury. Cell 2019;176(4):716–728 e718. [DOI] [PMC free article] [PubMed] [Google Scholar]
- [23].Davies AJ, Rinaldi S, Costigan M, Oh SB. Cytotoxic Immunity in Peripheral Nerve Injury and Pain. Front Neurosci-Switz 2020;14:142. [DOI] [PMC free article] [PubMed] [Google Scholar]
- [24].de Leeuw CA, Mooij JM, Heskes T, Posthuma D. MAGMA: generalized gene-set analysis of GWAS data. PLoS Comput Biol 2015;11(4):e1004219. [DOI] [PMC free article] [PubMed] [Google Scholar]
- [25].Dobin A, Davis CA, Schlesinger F, Drenkow J, Zaleski C, Jha S, Batut P, Chaisson M, Gingeras TR. STAR: ultrafast universal RNA-seq aligner. Bioinformatics 2013;29(1):15–21. [DOI] [PMC free article] [PubMed] [Google Scholar]
- [26].Dupont WD, Plummer WD Jr., Power and sample size calculations. A review and computer program. Control Clin Trials 1990;11(2):116–128. [DOI] [PubMed] [Google Scholar]
- [27].Dupuy FP, Kant S, Barbe A, Routy JP, Bruneau J, Lebouche B, Tremblay C, Pazgier M, Finzi A, Bernard NF. Antibody-Dependent Cellular Cytotoxicity-Competent Antibodies against HIV-1-Infected Cells in Plasma from HIV-Infected Subjects. mBio 2019;10(6). [DOI] [PMC free article] [PubMed] [Google Scholar]
- [28].Evdokimov D, Dinkel P, Frank J, Sommer C, Uceyler N. Characterization of dermal skin innervation in fibromyalgia syndrome. PLoS One 2020;15(1):e0227674. [DOI] [PMC free article] [PubMed] [Google Scholar]
- [29].Evdokimov D, Frank J, Klitsch A, Unterecker S, Warrings B, Serra J, Papagianni A, Saffer N, Meyer Zu Altenschildesche C, Kampik D, Malik RA, Sommer C, Uceyler N. Reduction of skin innervation is associated with a severe fibromyalgia phenotype. Ann Neurol 2019;86(4):504–516. [DOI] [PubMed] [Google Scholar]
- [30].Evdokimov D, Frank J, Klitsch A, Unterecker S, Warrings B, Serra J, Papagianni A, Saffer N, zu Altenschildesche CM, Kampik D, Malik RA, Sommer C, Üçeyler N. Reduction of skin innervation is associated with a severe fibromyalgia phenotype. Annals of neurology 2019;86(4):504–516. [DOI] [PubMed] [Google Scholar]
- [31].Galvez-Sanchez CM, Reyes Del Paso GA. Diagnostic Criteria for Fibromyalgia: Critical Review and Future Perspectives. J Clin Med 2020;9(4). [DOI] [PMC free article] [PubMed] [Google Scholar]
- [32].Gene Ontology C The Gene Ontology resource: enriching a GOld mine. Nucleic Acids Res 2021;49(D1):D325–D334. [DOI] [PMC free article] [PubMed] [Google Scholar]
- [33].Giacomelli C, Talarico R, Bombardieri S, Bazzichi L. The interaction between autoimmune diseases and fibromyalgia: risk, disease course and management. Expert Rev Clin Immunol 2013;9(11):1069–1076. [DOI] [PubMed] [Google Scholar]
- [34].Gianchecchi E, Delfino DV, Fierabracci A. NK cells in autoimmune diseases: Linking innate and adaptive immune responses. Autoimmun Rev 2018;17(2):142–154. [DOI] [PubMed] [Google Scholar]
- [35].Goebel A, Krock E, Gentry C, Israel MR, Jurczak A, Urbina CM, Sandor K, Vastani N, Maurer M, Cuhadar U, Sensi S, Nomura Y, Menezes J, Baharpoor A, Brieskorn L, Sandström A, Tour J, Kadetoff D, Haglund L, Kosek E, Bevan S, Svensson CI, DA A. Passive transfer of fibromyalgia symptoms from patients to mice. Journal of Clinical Investigation 2021;In press. [DOI] [PMC free article] [PubMed] [Google Scholar]
- [36].Gonzalez S, Lopez-Soto A, Suarez-Alvarez B, Lopez-Vazquez A, Lopez-Larrea C. NKG2D ligands: key targets of the immune response. Trends Immunol 2008;29(8):397–403. [DOI] [PubMed] [Google Scholar]
- [37].Grayston R, Czanner G, Elhadd K, Goebel A, Frank B, Uceyler N, Malik RA, Alam U. A systematic review and meta-analysis of the prevalence of small fiber pathology in fibromyalgia: Implications for a new paradigm in fibromyalgia etiopathogenesis. Semin Arthritis Rheum 2019;48(5):933–940. [DOI] [PubMed] [Google Scholar]
- [38].Han CL, Sheng YC, Wang SY, Chen YH, Kang JH. Serum proteome profiles revealed dysregulated proteins and mechanisms associated with fibromyalgia syndrome in women. Sci Rep 2020;10(1):12347. [DOI] [PMC free article] [PubMed] [Google Scholar]
- [39].Harris PA, Taylor R, Thielke R, Payne J, Gonzalez N, Conde JG. Research electronic data capture (REDCap)--a metadata-driven methodology and workflow process for providing translational research informatics support. J Biomed Inform 2009;42(2):377–381. [DOI] [PMC free article] [PubMed] [Google Scholar]
- [40].Imbeault M, Lodge R, Ouellet M, Tremblay MJ. Efficient magnetic bead-based separation of HIV-1-infected cells using an improved reporter virus system reveals that p53 up-regulation occurs exclusively in the virus-expressing cell population. Virology 2009;393(1):160–167. [DOI] [PubMed] [Google Scholar]
- [41].Jan Chalupny N, Sutherland CL, Lawrence WA, Rein-Weston A, Cosman D. ULBP4 is a novel ligand for human NKG2D. Biochemical and Biophysical Research Communications 2003;305(1):129–135. [DOI] [PubMed] [Google Scholar]
- [42].Judge SJ, Murphy WJ, Canter RJ. Characterizing the Dysfunctional NK Cell: Assessing the Clinical Relevance of Exhaustion, Anergy, and Senescence. Front Cell Infect Microbiol 2020;10:49. [DOI] [PMC free article] [PubMed] [Google Scholar]
- [43].Kaufmann I, Eisner C, Richter P, Huge V, Beyer A, Chouker A, Schelling G, Thiel M. Lymphocyte subsets and the role of TH1/TH2 balance in stressed chronic pain patients. Neuroimmunomodulation 2007;14(5):272–280. [DOI] [PubMed] [Google Scholar]
- [44].Kaufmann I, Schelling G, Eisner C, Richter HP, Beyer A, Krauseneck T, Chouker A, Thiel M. Decrease in adhesion molecules on polymorphonuclear leukocytes of patients with fibromyalgia. Rheumatol Int 2009;29(9):1109–1111. [DOI] [PubMed] [Google Scholar]
- [45].Kaufmann I, Schelling G, Eisner C, Richter HP, Krauseneck T, Vogeser M, Hauer D, Campolongo P, Chouker A, Beyer A, Thiel M. Anandamide and neutrophil function in patients with fibromyalgia. Psychoneuroendocrinology 2008;33(5):676–685. [DOI] [PubMed] [Google Scholar]
- [46].Korotkevich G, Sukhov V, Budin N, Shpak B, Artyomov MN, Sergushichev A. Fast gene set enrichment analysis. bioRxiv 2021:060012. [Google Scholar]
- [47].Kosehasanogullari M, Erdinc Gunduz N, Akalin E. Is Fibromyalgia Syndrome a Neuropathic Pain Syndrome? Archives of Rheumatology 2019;34(2):196–203. [DOI] [PMC free article] [PubMed] [Google Scholar]
- [48].Krokstad S, Langhammer A, Hveem K, Holmen TL, Midthjell K, Stene TR, Bratberg G, Heggland J, Holmen J. Cohort Profile: the HUNT Study, Norway. Int J Epidemiol 2013;42(4):968–977. [DOI] [PubMed] [Google Scholar]
- [49].Kucuksezer UC, Aktas Cetin E, Esen F, Tahrali I, Akdeniz N, Gelmez MY, Deniz G. The Role of Natural Killer Cells in Autoimmune Diseases. Front Immunol 2021;12:622306. [DOI] [PMC free article] [PubMed] [Google Scholar]
- [50].Kwiatkowska KM, Bacalini MG, Sala C, Kaziyama H, de Andrade DC, Terlizzi R, Giannini G, Cevoli S, Pierangeli G, Cortelli P, Garagnani P, Pirazzini C. Analysis of Epigenetic Age Predictors in Pain-Related Conditions. Front Public Health 2020;8:172. [DOI] [PMC free article] [PubMed] [Google Scholar]
- [51].Landis CA, Lentz MJ, Tsuji J, Buchwald D, Shaver JL. Pain, psychological variables, sleep quality, and natural killer cell activity in midlife women with and without fibromyalgia. Brain Behav Immun 2004;18(4):304–313. [DOI] [PubMed] [Google Scholar]
- [52].Laniosz V, Wetter DA, Godar DA. Dermatologic manifestations of fibromyalgia. Clin Rheumatol 2014;33(7):1009–1013. [DOI] [PubMed] [Google Scholar]
- [53].Lauria G, Hsieh ST, Johansson O, Kennedy WR, Leger JM, Mellgren SI, Noland M, Merkies ISJ, Polydefkis M, Smith AG, Sommer C, Valls-Sole J, PNS JTFE. European Federation of Neurological Societies/Peripheral Nerve Society Guideline on the use of skin biopsy in the diagnosis of small fiber neuropathy. Report of a joint task force of the European Federation of Neurological Societies and the Peripheral Nerve Society. J Peripher Nerv Syst 2010;15(2):79–92. [DOI] [PubMed] [Google Scholar]
- [54].Lekander M, Fredrikson M, Wik G. Neuroimmune relations in patients with fibromyalgia: a positron emission tomography study. Neurosci Lett 2000;282(3):193–196. [DOI] [PubMed] [Google Scholar]
- [55].Lemieux J, Jobin C, Simard C, Neron S. A global look into human T cell subsets before and after cryopreservation using multiparametric flow cytometry and two-dimensional visualization analysis. J Immunol Methods 2016;434:73–82. [DOI] [PubMed] [Google Scholar]
- [56].Liao Y, Smyth GK, Shi W. featureCounts: an efficient general purpose program for assigning sequence reads to genomic features. Bioinformatics 2014;30(7):923–930. [DOI] [PubMed] [Google Scholar]
- [57].Lisovsky I, Kant S, Tremblay-McLean A, Isitman G, Kiani Z, Dupuy FP, Gilbert L, Bruneau J, Shoukry NH, Lebouche B, Bernard NF. Differential contribution of education through KIR2DL1, KIR2DL3, and KIR3DL1 to antibody-dependent (AD) NK cell activation and ADCC. J Leukoc Biol 2019;105(3):551–563. [DOI] [PMC free article] [PubMed] [Google Scholar]
- [58].Loh PR, Tucker G, Bulik-Sullivan BK, Vilhjalmsson BJ, Finucane HK, Salem RM, Chasman DI, Ridker PM, Neale BM, Berger B, Patterson N, Price AL. Efficient Bayesian mixed-model analysis increases association power in large cohorts. Nat Genet 2015;47(3):284–290. [DOI] [PMC free article] [PubMed] [Google Scholar]
- [59].Love MI, Huber W, Anders S. Moderated estimation of fold change and dispersion for RNA-seq data with DESeq2. Genome Biol 2014;15(12):550. [DOI] [PMC free article] [PubMed] [Google Scholar]
- [60].Lukkahatai N, Walitt B, Espina A, Wang D, Saligan LN. Comparing Genomic Profiles of Women With and Without Fibromyalgia. Biol Res Nurs 2015;17(4):373–383. [DOI] [PMC free article] [PubMed] [Google Scholar]
- [61].Macedo JA, Hesse J, Turner JD, Ammerlaan W, Gierens A, Hellhammer DH, Muller CP. Adhesion molecules and cytokine expression in fibromyalgia patients: increased L-selectin on monocytes and neutrophils. J Neuroimmunol 2007;188(1–2):159–166. [DOI] [PubMed] [Google Scholar]
- [62].Macedo JA, Hesse J, Turner JD, Meyer J, Hellhammer DH, Muller CP. Glucocorticoid sensitivity in fibromyalgia patients: decreased expression of corticosteroid receptors and glucocorticoid-induced leucine zipper. Psychoneuroendocrinology 2008;33(6):799–809. [DOI] [PubMed] [Google Scholar]
- [63].Martinet L, Smyth MJ. Balancing natural killer cell activation through paired receptors. Nat Rev Immunol 2015;15(4):243–254. [DOI] [PubMed] [Google Scholar]
- [64].Martinez-Lavin M. Fibromyalgia and small fiber neuropathy: the plot thickens! Clin Rheumatol 2018;37(12):3167–3171. [DOI] [PubMed] [Google Scholar]
- [65].Mascarenhas RO, Souza MB, Oliveira MX, Lacerda AC, Mendonca VA, Henschke N, Oliveira VC. Association of Therapies With Reduced Pain and Improved Quality of Life in Patients With Fibromyalgia: A Systematic Review and Meta-analysis. JAMA Intern Med 2021;181(1):104–112. [DOI] [PMC free article] [PubMed] [Google Scholar]
- [66].Masterson BJ, Galask RP, Ballas ZK. Natural killer cell function in women with vestibulitis. J Reprod Med 1996;41(8):562–568. [PubMed] [Google Scholar]
- [67].Meester I, Rivera-Silva GF, Gonzalez-Salazar F. Immune System Sex Differences May Bridge the Gap Between Sex and Gender in Fibromyalgia. Front Neurosci-Switz 2019;13:1414. [DOI] [PMC free article] [PubMed] [Google Scholar]
- [68].Michel T, Poli A, Cuapio A, Briquemont B, Iserentant G, Ollert M, Zimmer J. Human CD56bright NK Cells: An Update. J Immunol 2016;196(7):2923–2931. [DOI] [PubMed] [Google Scholar]
- [69].Nishikai M [Chronic fatigue syndrome--study of 51 cases treated at the Second Tokyo National Hospital]. Nihon Rinsho 1992;50(11):2641–2647. [PubMed] [Google Scholar]
- [70].Nugraha B, Korallus C, Kielstein H, Gutenbrunner C. CD3+CD56+natural killer T cells in fibromyalgia syndrome patients: association with the intensity of depression. Clin Exp Rheumatol 2013;31(6 Suppl 79):S9–15. [PubMed] [Google Scholar]
- [71].Panicker AK, Buhusi M, Thelen K, Maness PF. Cellular signalling mechanisms of neural cell adhesion molecules. Front Biosci 2003;8:d900–911. [DOI] [PubMed] [Google Scholar]
- [72].Pernambuco AP, Fonseca ACS, Oliveira GLd, Faria PC, Silva RV, Meireles C, Arantes SE, Silva FC, Reis DdÁ. Increased Levels of IL-17, IL-23, MIP-1α, MCP-1 and Global Leukocytes in Fibromyalgia Patients. Myopain 2017;23(3–4):172–181. [Google Scholar]
- [73].Poli A, Michel T, Theresine M, Andres E, Hentges F, Zimmer J. CD56bright natural killer (NK) cells: an important NK cell subset. Immunology 2009;126(4):458–465. [DOI] [PMC free article] [PubMed] [Google Scholar]
- [74].Queiroz LP. Worldwide epidemiology of fibromyalgia. Curr Pain Headache Rep 2013;17(8):356. [DOI] [PubMed] [Google Scholar]
- [75].Reimand J, Isserlin R, Voisin V, Kucera M, Tannus-Lopes C, Rostamianfar A, Wadi L, Meyer M, Wong J, Xu C, Merico D, Bader GD. Pathway enrichment analysis and visualization of omics data using g:Profiler, GSEA, Cytoscape and EnrichmentMap. Nat Protoc 2019;14(2):482–517. [DOI] [PMC free article] [PubMed] [Google Scholar]
- [76].Romee R, Foley B, Lenvik T, Wang Y, Zhang B, Ankarlo D, Luo X, Cooley S, Verneris M, Walcheck B, Miller J. NK cell CD16 surface expression and function is regulated by a disintegrin and metalloprotease-17 (ADAM17). Blood 2013;121(18):3599–3608. [DOI] [PMC free article] [PubMed] [Google Scholar]
- [77].Russell IJ, Vipraio GA, Michalek JE, Craig FE, Kang YK, Richards AB. Lymphocyte markers and natural killer cell activity in fibromyalgia syndrome: effects of low-dose, sublingual use of human interferon-alpha. J Interferon Cytokine Res 1999;19(8):969–978. [DOI] [PubMed] [Google Scholar]
- [78].Sluka KA, Clauw DJ. Neurobiology of fibromyalgia and chronic widespread pain. Neuroscience 2016;338:114–129. [DOI] [PMC free article] [PubMed] [Google Scholar]
- [79].Stanley N, Stelzer IA, Tsai AS, Fallahzadeh R, Ganio E, Becker M, Phongpreecha T, Nassar H, Ghaemi S, Maric I, Culos A, Chang AL, Xenochristou M, Han X, Espinosa C, Rumer K, Peterson L, Verdonk F, Gaudilliere D, Tsai E, Feyaerts D, Einhaus J, Ando K, Wong RJ, Obermoser G, Shaw GM, Stevenson DK, Angst MS, Gaudilliere B, Aghaeepour N. VoPo leverages cellular heterogeneity for predictive modeling of single-cell data. Nat Commun 2020;11(1):3738. [DOI] [PMC free article] [PubMed] [Google Scholar]
- [80].Sudlow C, Gallacher J, Allen N, Beral V, Burton P, Danesh J, Downey P, Elliott P, Green J, Landray M, Liu B, Matthews P, Ong G, Pell J, Silman A, Young A, Sprosen T, Peakman T, Collins R. UK biobank: an open access resource for identifying the causes of a wide range of complex diseases of middle and old age. PLoS Med 2015;12(3):e1001779. [DOI] [PMC free article] [PubMed] [Google Scholar]
- [81].Tremblay-McLean A, Coenraads S, Kiani Z, Dupuy FP, Bernard NF. Expression of ligands for activating natural killer cell receptors on cell lines commonly used to assess natural killer cell function. BMC Immunology 2019;20(1):8. [DOI] [PMC free article] [PubMed] [Google Scholar]
- [82].Tripodi D, Lyons S, Davies D. Separation of peripheral leukocytes by Ficoll density gradient centrifugation. Transplantation 1971;11(5):487–488. [DOI] [PubMed] [Google Scholar]
- [83].Tuncer T, Butun B, Arman M, Akyokus A, Doseyen A. Primary fibromyalgia and allergy. Clin Rheumatol 1997;16(1):9–12. [DOI] [PubMed] [Google Scholar]
- [84].Vecchio E, Lombardi R, Paolini M, Libro G, Delussi M, Ricci K, Quitadamo SG, Gentile E, Girolamo F, Iannone F, Lauria G, de Tommaso M. Peripheral and central nervous system correlates in fibromyalgia. Eur J Pain 2020;24(8):1537–1547. [DOI] [PubMed] [Google Scholar]
- [85].Vines SW, Gupta S, Whiteside T, Dostal-Johnson D, Hummler-Davis A. The relationship between chronic pain, immune function, depression, and health behaviors. Biol Res Nurs 2003;5(1):18–29. [DOI] [PubMed] [Google Scholar]
- [86].Vivier E, Tomasello E, Baratin M, Walzer T, Ugolini S. Functions of natural killer cells. Nat Immunol 2008;9(5):503–510. [DOI] [PubMed] [Google Scholar]
- [87].Willer CJ, Li Y, Abecasis GR. METAL: fast and efficient meta-analysis of genomewide association scans. Bioinformatics 2010;26(17):2190–2191. [DOI] [PMC free article] [PubMed] [Google Scholar]
- [88].Wolfe F, Clauw DJ, Fitzcharles MA, Goldenberg DL, Hauser W, Katz RS, Mease P, Russell AS, Russell IJ, Winfield JB. Fibromyalgia criteria and severity scales for clinical and epidemiological studies: a modification of the ACR Preliminary Diagnostic Criteria for Fibromyalgia. J Rheumatol 2011;38(6):1113–1122. [DOI] [PubMed] [Google Scholar]
- [89].Wolfe F, Clauw DJ, Fitzcharles MA, Goldenberg DL, Katz RS, Mease P, Russell AS, Russell IJ, Winfield JB, Yunus MB. The American College of Rheumatology Preliminary Diagnostic Criteria for Fibromyalgia and Measurement of Symptom Severity. Arthrit Care Res 2010;62(5):600–610. [DOI] [PubMed] [Google Scholar]
- [90].Yang Q, Wang G, Zhang F. Role of Peripheral Immune Cells-Mediated Inflammation on the Process of Neurodegenerative Diseases. Front Immunol 2020;11:582825. [DOI] [PMC free article] [PubMed] [Google Scholar]
- [91].Yunus MB. Editorial Review: An Update on Central Sensitivity Syndromes and the Issues of Nosology and Psychobiology. Current Rheumatology Reviews 2015;11(2):70–85. [DOI] [PubMed] [Google Scholar]
- [92].Zhang Z, Feng J, Mao A, Le K, La Placa D, Wu X, Longmate J, Marek C, St Amand RP, Neuhausen SL, Shively JE. SNPs in inflammatory genes CCL11, CCL4 and MEFV in a fibromyalgia family study. PLoS One 2018;13(6):e0198625. [DOI] [PMC free article] [PubMed] [Google Scholar]
- [93].Zhou W, Nielsen JB, Fritsche LG, Dey R, Gabrielsen ME, Wolford BN, LeFaive J, VandeHaar P, Gagliano SA, Gifford A, Bastarache LA, Wei WQ, Denny JC, Lin M, Hveem K, Kang HM, Abecasis GR, Willer CJ, Lee S. Efficiently controlling for case-control imbalance and sample relatedness in large-scale genetic association studies. Nat Genet 2018;50(9):1335–1341. [DOI] [PMC free article] [PubMed] [Google Scholar]
- [94].Zingoni A, Molfetta R, Fionda C, Soriani A, Paolini R, Cippitelli M, Cerboni C, Santoni A. NKG2D and Its Ligands: “One for All, All for One”. Front Immunol 2018;9:476. [DOI] [PMC free article] [PubMed] [Google Scholar]
Associated Data
This section collects any data citations, data availability statements, or supplementary materials included in this article.