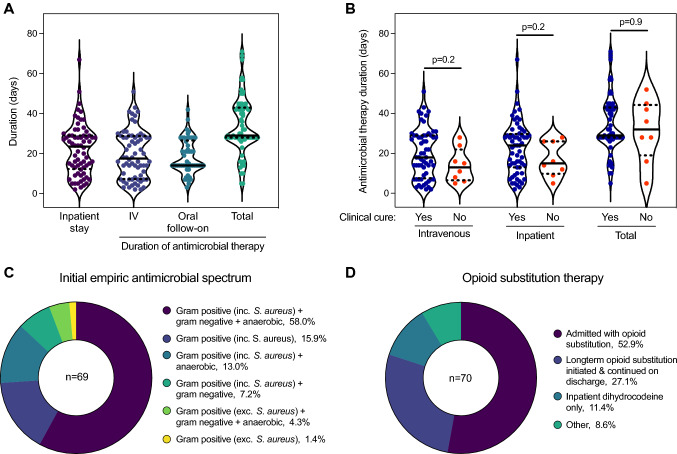
Fig. 1.
Inpatient management. A Duration of inpatient stay and antimicrobial therapy (intravenous [IV], oral, and total [IV and oral combined]). B Comparison of the duration of intravenous, inpatient and total antimicrobial therapy between patients with and without clinical cure. Data available for 68 patients. Groups compared by Mann Whitney test. Solid line within violin plot shows median and dotted lines show first and third quartiles. C Initial spectrum of empiric antimicrobial therapy. Definitions of different spectra are presented in Supplementary Table 3. D Opioid substitution therapy

