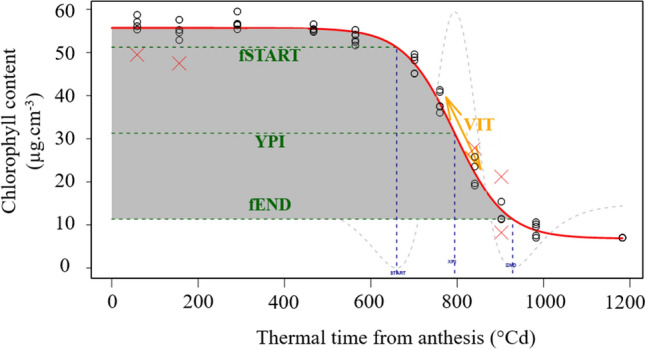
Fig. 1.

Example of the fitted logistic curve for modeling senescence and estimating stay-green traits. The red curve is an example of the fitted logistic curve for plant 455 in the 2016 experiment; the black open dots represent the raw data; the red crosses represent outliers; green and blue dashed lines are, respectively, the y-axis and x-axis coordinates of the start (START), the point of inflection (PI) and the end (END) of senescence; the dashed gray curve is the third derivative of the function which at its minima defines the start and end of senescence and at its maximum defines the x-axis of the point of inflection; the orange arrow indicates the maximal senescence rate; and the gray shading represents the area under the senescence curve (AUC)
