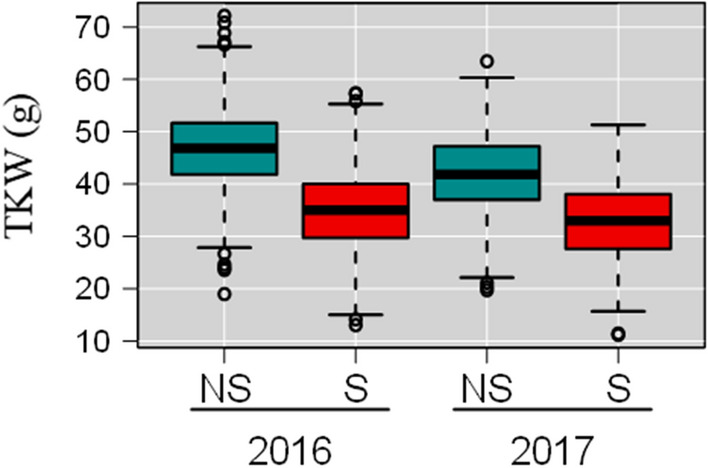
Fig. 2.

Boxplot of TKW for 199 wheat cultivars grown over two years (2016 and 2017) with two post-flowering temperature treatments (NS no stress, S stress). gBLUP values calculated from Eq. 2 were used (see "Materials and methods"). Quartiles and medians are used to construct the boxes. Whiskers extend to 1.5 times the interquartile range from the box. The means of each sample are significantly different from each other (α = 0.001) based on Tukey HSD test
