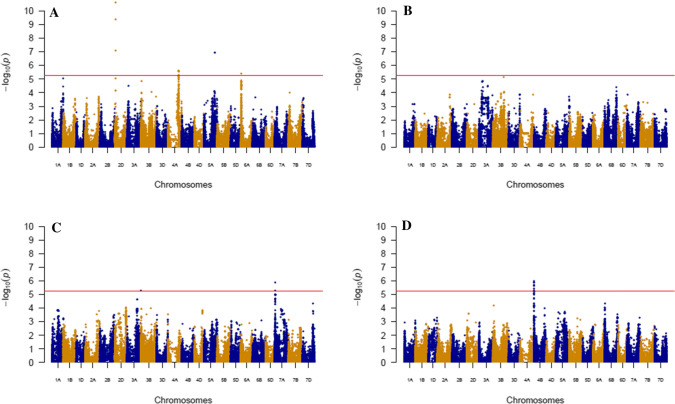
Fig. 5.
Manhattan plot of the GWAS of the SNP main effect and the SNP × treatment interaction for flowering date (D.Z65) and TKW measured on 199 wheat varieties grown in stress or non-stress post-flowering temperature treatments. a SNP main effect for D.Z65; b SNP by treatment interaction for D.Z65; d SNP main effect for TKW; c SNP by treatment interaction for TKW. The red line represents the 5.6 significant threshold calculated as described by Gao et al. (2015)

