Fig. 2.
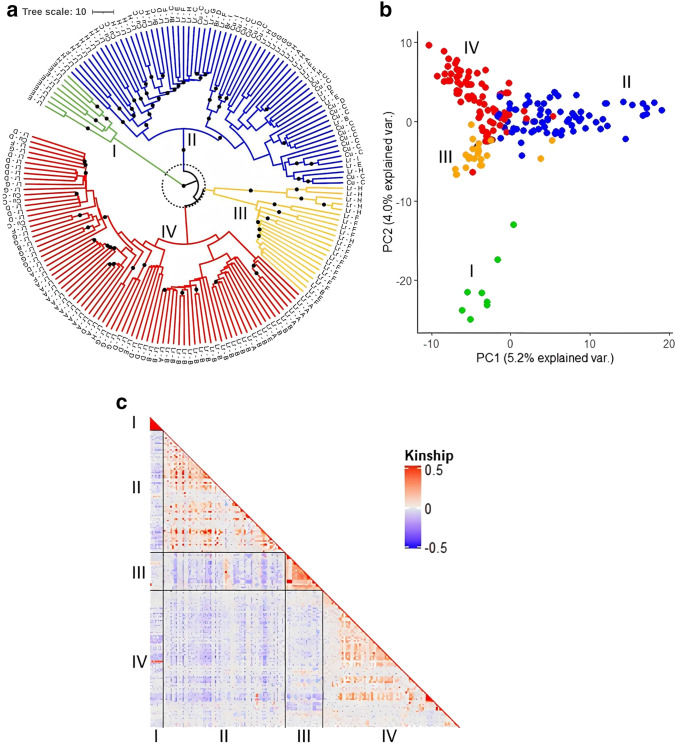
Genetic diversity and population structure of 181 white lupin accessions. a Ward cluster analysis (1,000 bootstraps). Colors represent subgroups (I-IV). Black dots represent bootstrap support values (> 90), and dotted circle indicates branch length of 10. Letters indicate accession type (inner) and region of origin (outer) with Lr = landrace, Cu = cultivar, Br = breeding line, A = Atlantic Isles, B = Iberian Peninsula, C = West and Eastern Europe, D = North-East Mediterranean, E = South-East Mediterranean, F = Egypt, G = South-West Mediterranean, H = East Africa and I = Chile. b Principal component analysis (PCA). Each dot represents an accession and colors represent subgroups (I-IV). c Heatmap of the Astle kinship value among accessions

