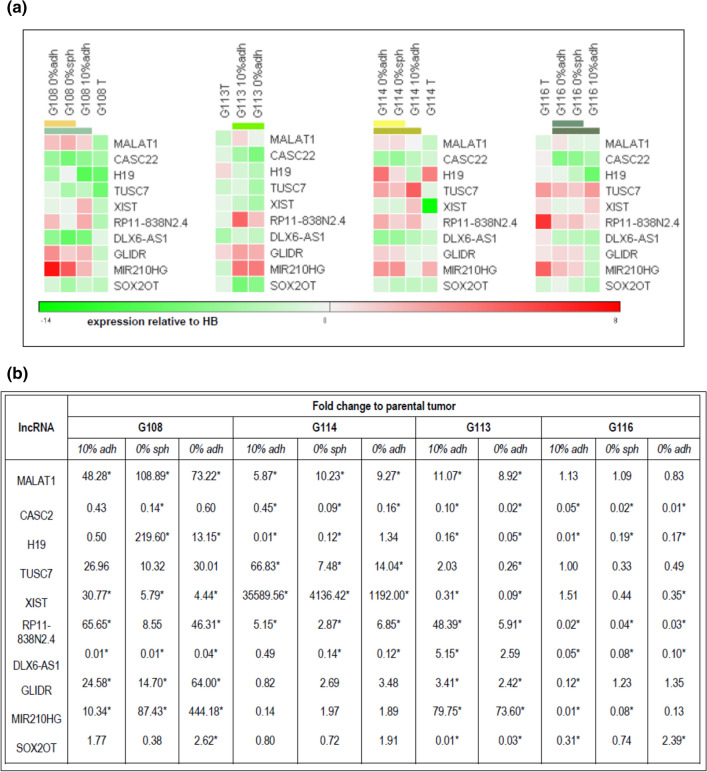
Fig. 3.
Results of expression analysis for the lncRNAs related to GB drug resistance. Heat maps were generated based on ΔΔCT values (relative to control—human brain; HB). Hierarchical clustering analyses highlighted divergence between lncRNAs profiles of initial tumors and the cells in vitro, and demonstrated closer similarity of serum-free models in comparison to serum-supplemented cultures. The results of clustering according to the samples (columns) are depicted as colored bars in the heat map representing the hierarchical tree splitting at different levels. The root of the tree is located at the bottom, the leaves at the top (a). To visualize the scale of lncRNA profile changes, the data were expressed as fold change of level in particular models relative to parental tumor. The comparative analysis confirmed the significance of differences between in vitro models and the tumors in vivo (*); p < 0.05

