Fig. 4.
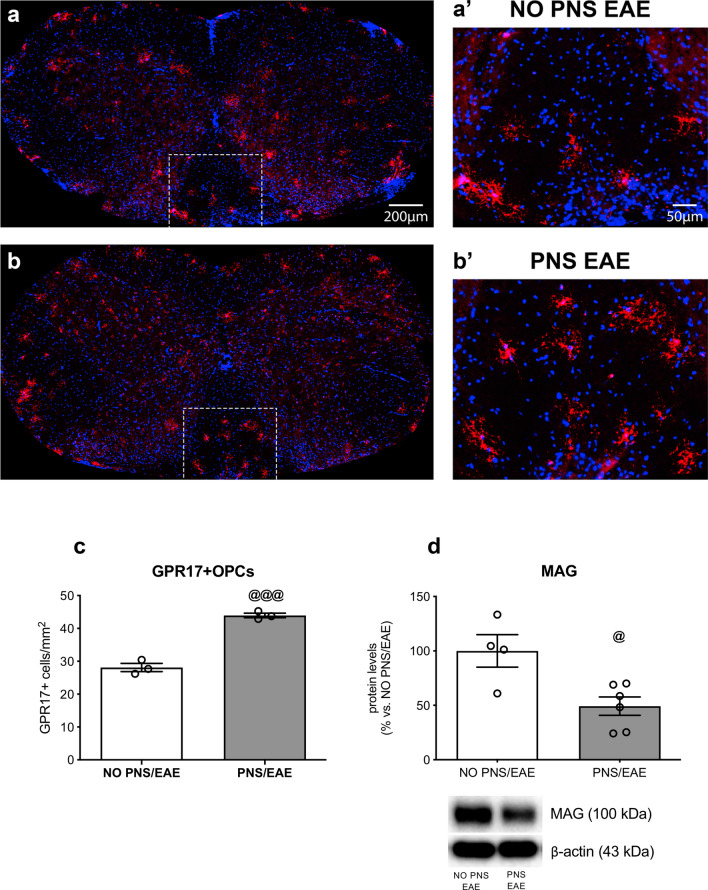
Analyses of GPR17 and MAG in the cervical spinal cord. a, b Distribution of GPR17 + cells (in red) in cervical spinal cord sections of not stressed mice the developed the encephalomyelitis (NO PNS/EAE) and prenatally stressed animals that developed the encephalomyelitis (PNS/EAE). Cell nuclei were labeled with Hoechst 33258 (in blue). a′, b′ Higher magnification insets showing GPR17 + cell density in the white matter ventral region. c The graph shows the number of GPR17 positive cells per mm2 (GPR17 +) in the 2 groups. Cells were counted in the whole white matter of 3 cervical spinal cord sections for each animal (n = 3 mice/group). d MAG protein levels were investigated in the same region using western blot analysis (n = 5/6 mice/group). GPR17 + counting data are expressed as mean of the examined variable ± SEM. MAG protein levels are expressed as a percentage of non-stressed EAE mice (NO PNS/EAE, set at 100%) and represent the mean ± SEM. @P < 0.05, @@@P < 0.001 vs. NO PNS/EAE (Unpaired t test)

