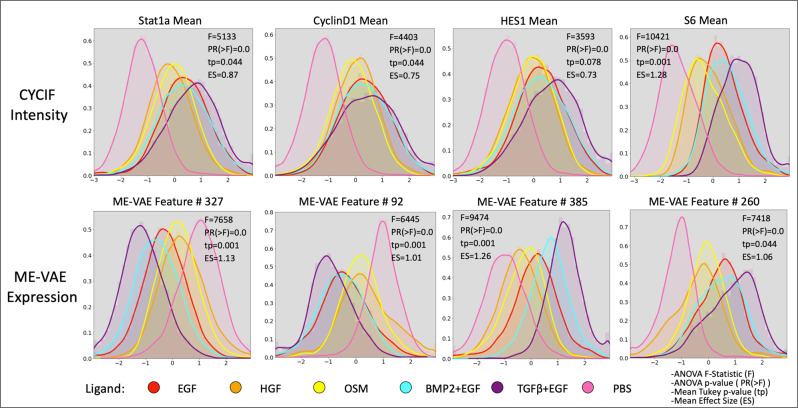
Fig. 5. Separability of ligands using individual ME-VAE features.
Density function for several CYCIF and ME-VAE feature pairs. A two-sided ANOVA was performed for features and intensities between populations in order to compute the F statistic and p value (PR(>F)). Subsequently, the mean Tukey pairwise p value across ligands and mean effect size are shown for each feature. ME-VAE features used for comparison were the features with the largest correlation to the respective CYCIF marker. This analysis utilized all 73,134 cell images from the MCF10A dataset.

