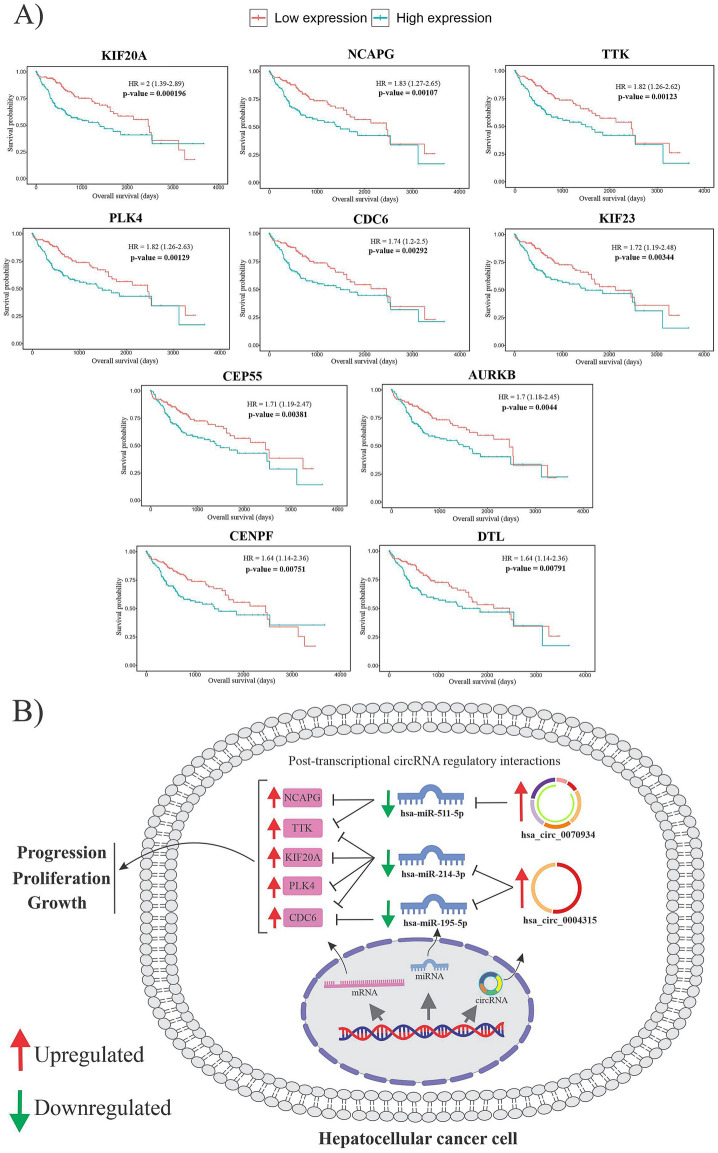
Figure 10.
(A) The overall survival time of ten hub genes. In Kaplan–Meier plots, red lines indicate patients with lower hub gene expression, whereas green lines indicate greater hub gene expression. (B) The figure demonstrates a schematic illustration of the DECs-FImiRNAs-FImRNA regulatory network for five final hub genes located inside the cytoplasm. The upregulation of two DECs causes the downregulation of three miRNAs, limiting miRNA-mediated hub gene degradation, and HCC may develop due to hepatic overexpression of these five hub genes.

