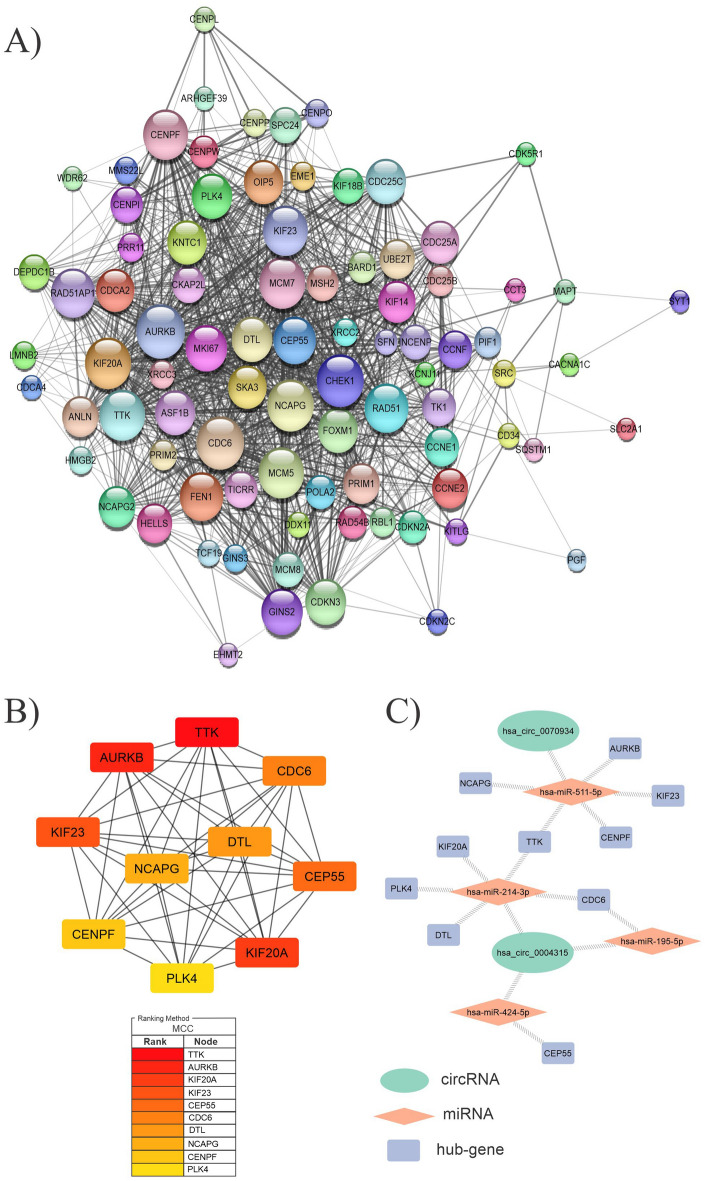
Figure 9.
(A) A PPI network involving 204 genes has been associated with overall survival. The size of the node reflects the degree of value of the genes. (B) a network of ten hub genes. MCC scores were used to determine the top ten hub genes in the PPI network using the CytoHubba plugin of the Cytoscape software. The figure shows the significance of hubs on a color scale ranging from red to yellow, with red being the most important and yellow being the least important. (C) Network shows the interactions between selected DECs, FImiRNAs, and hub genes. DECs, FImiRNAs, hub genes are shown in green, red, and blue, respectively.

