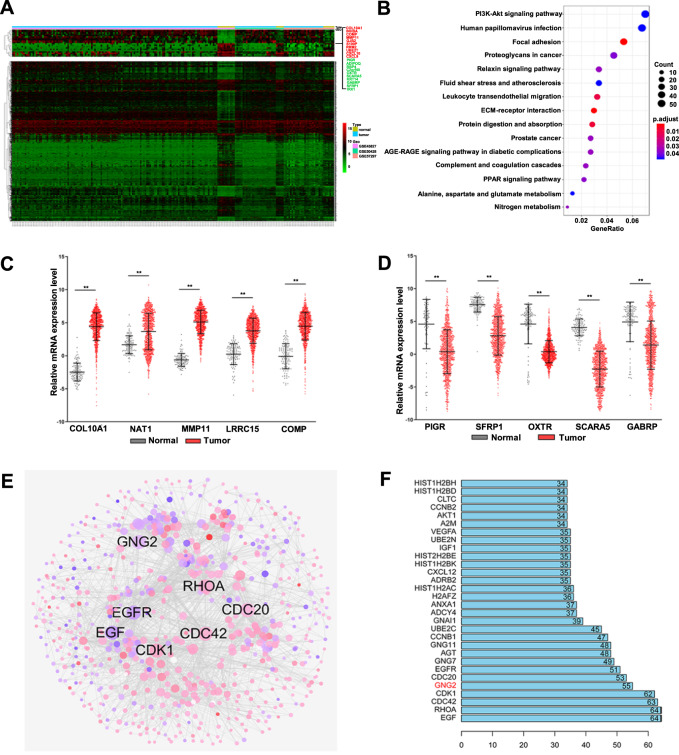
Fig. 1. Identification of differential expressed genes (DEGs).
A Heat maps of the expression levels of DEGs from GEO showed significant differential expression between breast cancer (BC) and normal tissues. B KEGG pathway map of the DEGs. C The upregulated DEGs obtained from GEO were verified by the TCGA database. D The downregulated DEGs obtained from GEO were verified by the TCGA database. E Protein-protein interaction (PPI) network constructed with the DEGs. Node size was proportional to its degree. Red nodes represented upregulated genes, and blue nodes represent downregulated genes. F The sequence of the top 30 genes with the highest degrees. Error bars indicated SEM. **p < 0.01.

