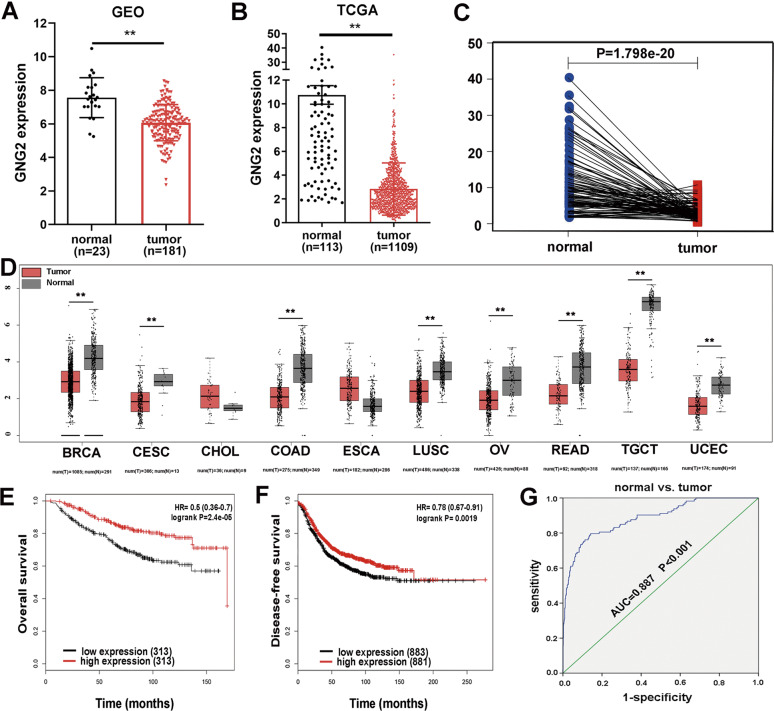
Fig. 2. Identification of GNG2 in breast cancer (BC).
A and B GNG2 expression levels were obtained from the GEO database (A) and TCGA database (B) in normal and BC tissues. C The pairing difference analysis of GNG2 expression between tumor and normal tissues. D GNG2 expression obtained from GEPIA analysis in multiple cancers including BC, and cervical squamous cell carcinoma (CESC), etc. E Kaplan-Meier survival curves for overall survival (OS) according to GNG2 expression levels in BC subjects. F Disease-free survival (DFS) curve based on GNG2 expression levels in BC subjects. G ROC curve for GNG2 expression in normal and BC tissues. Error bars indicate SEM. **p < 0.01.

