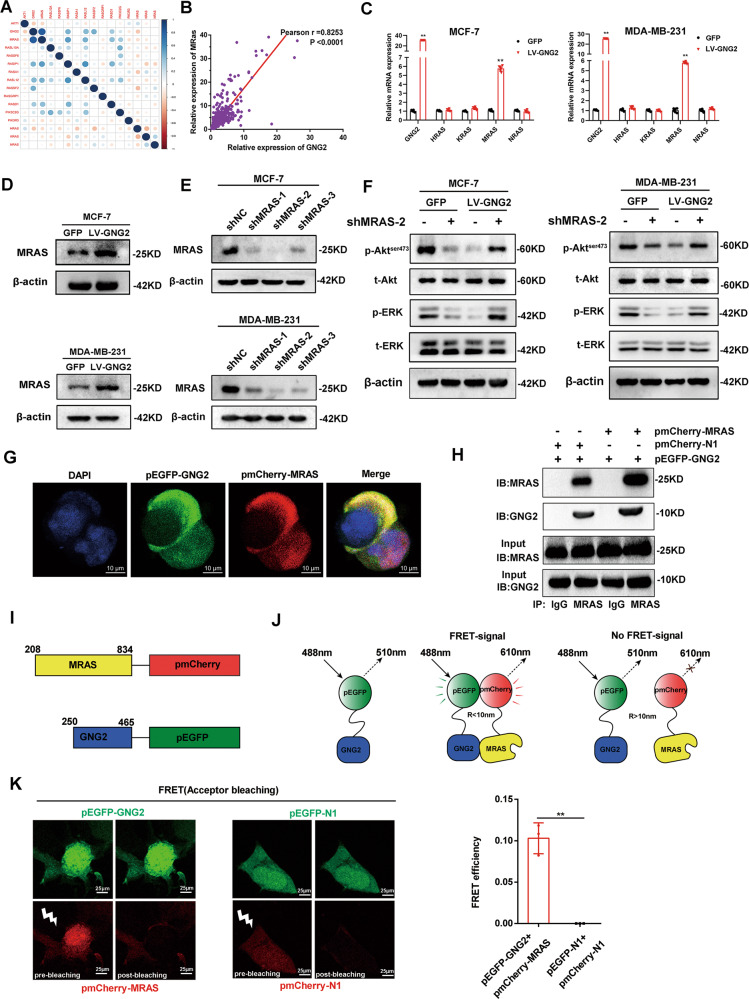
Fig. 7. GNG2 inhibits ERK and Akt activity in an MRAS dependent manner.
A Correlation analysis between GNG2 and RAS family proteins in BC tissues. B Correlation between GNG2 and MRAS expression in BC tissues. C The mRNA expression of GNG2 and RAS family genes in MCF-7 and MDA-MB-231 cells (n = 6). D Protein expression of MRAS in GNG2- or GFP-transfected MCF-7 and MDA-MB-231 cells. E Transfection efficiency of pGV-shMRAS-1-3 in MCF-7 and MDA-MB-231 cell. F Total and phosphorylated Akt and ERK in LV-GNG2 or LV-GFP-transected MCF-7 and MDA-MB-231 cells treated with or without pGV-shMRAS-2. G Subcellular localization of GNG2 and MRAS in HEK293T cells was observed by confocal imaging. Scale bars, 10 μm. H Co-immunoprecipitation (Co-IP) of GNG2 and MRAS was performed. MCF-7 cells were co-transfected with pEGFP-GNG2 and pmCherry-MRAS or pEGFP-GNG2 and pmCherry-N1 for 48 h. Cell lysates were then collected for immunoprecipitation (IP) with anti-MARS or control IgG antibodies as indicated in the methods. I Schematic description of constructs used for FRET assay. The number represents the amino acid residue of the protein. Two fluorescent proteins, GFP and mCherry, were attached to C-terminals of the GNG2 and MRAS proteins, respectively. J Schematic representation for the in vitro FRET assay, which measures two-component protein interaction system. GFP-GNG2 was excited by light of 488 nm with a bandwidth of 10 nm (488–10 nm). After excitation, it emited radiation with a longer wavelength of 510–10 nm. When GNG2 interacted with MRAS, the receptor (mCherry) approached GFP closely. FRET signal of 610–10 nm emission was then generated between two fluorescent proteins. R represents the distance between two fluorescent proteins. K Fluorescence imaging (left) and efficiency (right) of FRET assay for the interaction between the GNG2 and MRAS in MCF-7 cells. Data are expressed as the mean ± SD. ** p < 0.01 vs. GFP.

