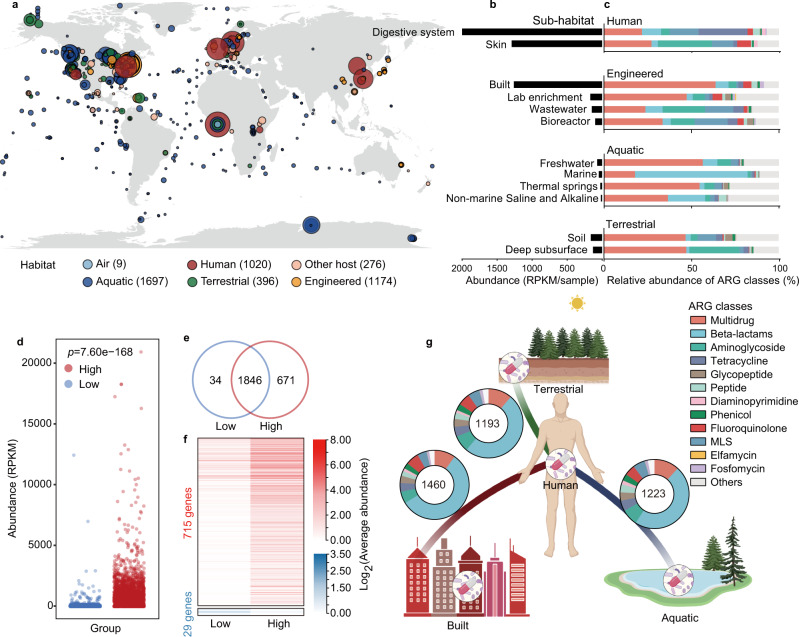
Fig. 1. Distribution patterns of antibiotic resistance genes (ARGs) globally.
a Geographic distribution of samples with ARG abundance in various habitats. Each point indicates one sampling location, rounded to the nearest degree, with point size reflecting the number of samples, and point color indicating the habitat. Samples with the unclassified location was showed as longitude = 0 and latitude = 0. b Abundance of ARGs in each sub-habitat. Digestive system of human, mainly including the fecal samples, had the highest abundances of ARGs. c Composition of antibiotic resistome in each sub-habitat. Only sub-habitats containing at least 20 samples are shown. d High-intensity human activities significantly promoted the abundance of ARGs. Each dot represents one sample (n = 1643 and 2309 samples for Low- and High-group, respectively). The p value represents the statistical significance (two-tailed Welch’s t-test). e Number of ARGs specific or shared in the areas with low- or high-intensity human activities. There were 671 ARGs specifically detected in high-intensity human activities environment. f The abundance of 715 and 29 ARGs significantly increased in high- and low-intensity human activities environment, respectively (adjust p < 0.05, two-tailed Welch’s t-test; Supplementary Data 3). g ARGs shared between the human-associated and three main habitats. Number in the circles represents the number of shared ARGs.

