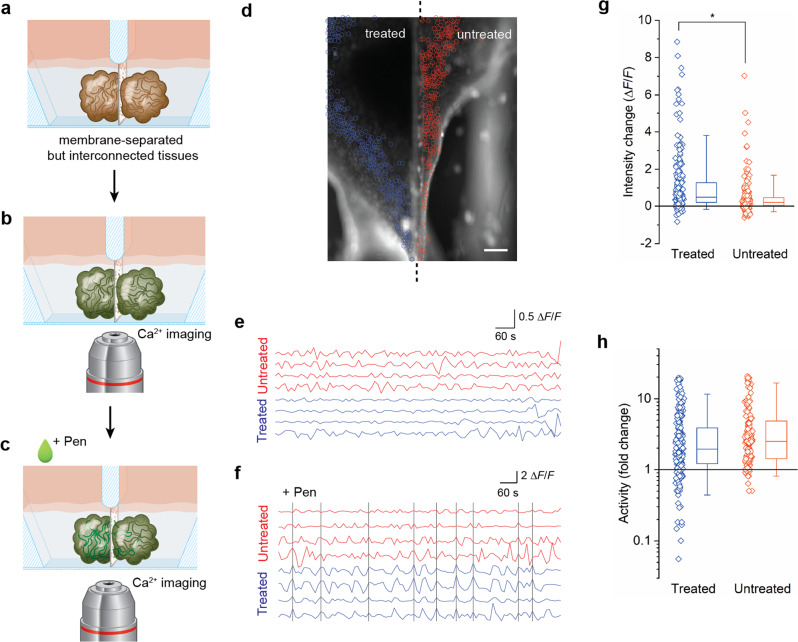
Fig. 3. Signal propagation between interconnected cerebral tissues.
a–c Schematics indicating the steps involved in the Penicillin-treatment experiments. Two cerebral tissues were generated in the two chambers of the PDMS-based iS3CC chip (see also Supplementary Fig. 2 for more details of the chip) and formed a connection through the porous membrane (a, see also Supplementary Fig. 3). To study the propagation of abnormal discharges from one tissue to the other, calcium imaging was performed on both tissues (b) and Penicillin G (“Pen”) was added to one of the chambers (c). d Fluorescence pictures of intracellular calcium detected by fluo-4 direct in cerebral tissues at day 45 where one of the chambers (left, “treated”) was treated with Penicillin G, whereas the other (right, “untreated”) was not. The activity of 522 neurons was detected in the treated (blue circles) and untreated (red circles) tissues and analyzed by live calcium imaging (see also Supplementary Movie 3). Scale bar: 250 µm (n = 6 samples across six independent experiments). e, f Time traces of four selected cells in the treated (blue) and untreated (red) cerebral tissues pre- (e) and post-treatment (f) with Penicillin G (see also Supplementary Fig. 4). The black vertical lines indicate instances where all four cells in the treated tissue showed synchronized transient peaks. This synchronicity propagated ~45% of the time to the cells in the untreated tissue. g, h Quantification of the change in fluorescence intensity (g) and fold change in neuronal activity (h, log scale) induced by the addition of Penicillin G in the treated (blue) and untreated (red) cerebral tissues. The symbols represent data for each cell; the boxes represent the median, first, and third quartiles; and the whiskers represent the fifth and 95th percentiles of the population data. Asterisk denotes statistically significant difference (Mann–Whitney U-test, p < 10−11).

