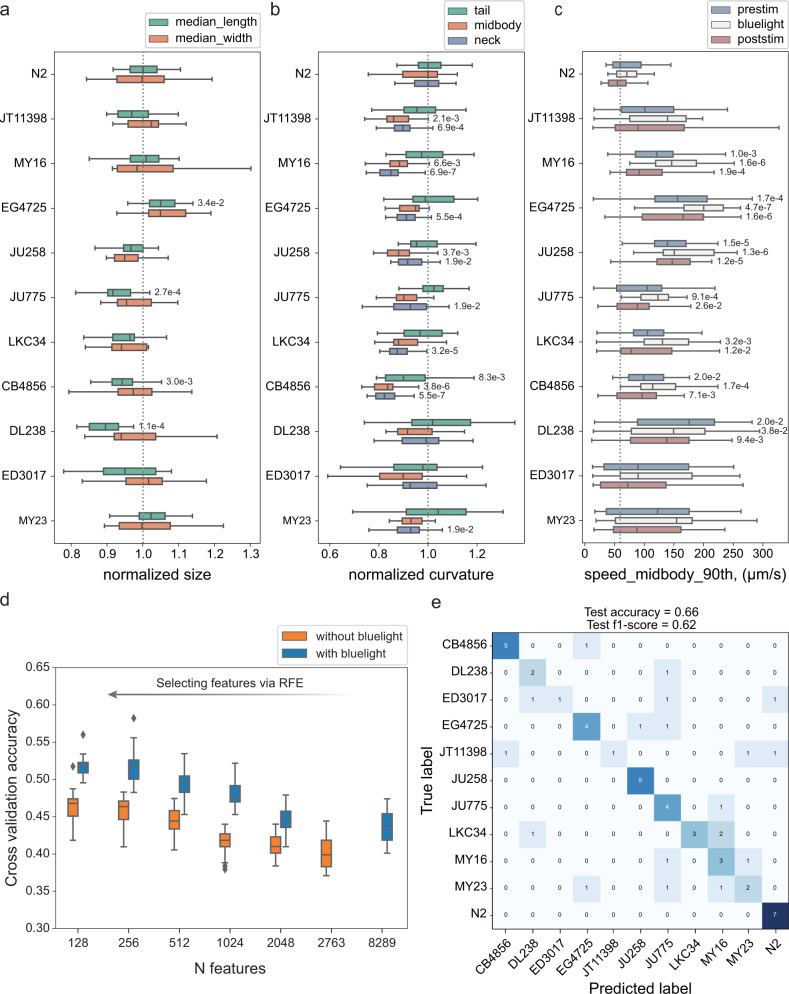
Fig. 2. Natural variation in behaviour.
a–c Examples of features describing morphology, movement, and posture. Each box shows median, 25th and 75th percentile (central mark, left and right edge, respectively), while whiskers show the rest of the distribution except for outliers (outside 1.5 times the IQR above the 75th and below the 25th percentile). Numbers near the boxplots are the p-values indicating statistically significant differences between N2 and wild isolates at a false discovery rate of 5% using Kruskal-Wallis tests and correcting for multiple comparisons with the Benjamin-Yekutieli method. P-values are omitted for nonsignificant differences. a Morphological differences were detected between strains. The length and the midbody width varied in a nonuniform way among strains. b Adequate resolution enabled detailed characterisation of the worm posture and the detection of differences among strains in multiple dimensions. The curvature at different parts of the body varied in a nonuniform way among strains. The neck curvature showed more significant differences. The parts of the body are defined following the conventions adopted in Tierpsy Tracker35. c The speed of wild isolates was on average higher than the speed of N2 worms. The response of wild isolates to blue light stimulus varied; some strains (e.g. EG4725) were more sensitive to blue light compared to N2, while others showed less obvious escape response (e.g. DL238). This provided additional dimensions to the behavioural phenotype. d Using the quantitative behavioural phenotypes, strains were classified with significantly higher accuracy than random. Combining features from different blue light conditions increased the dimensionality of the data and the classification accuracy between strains. e Worm strains were predicted in a held-out test set with 66% accuracy which is higher than random (9%). Sample size, in wells (3 worms per well): NN2 = 34, NJT11398 = 21, NMY16 = 27, NEG4725 = 29, NJU258 = 25, NJU775 = 25, NLKC34 = 27, NCB4856 = 29, NDL238 = 16, NED3017 = 20, NMY23 = 23.

