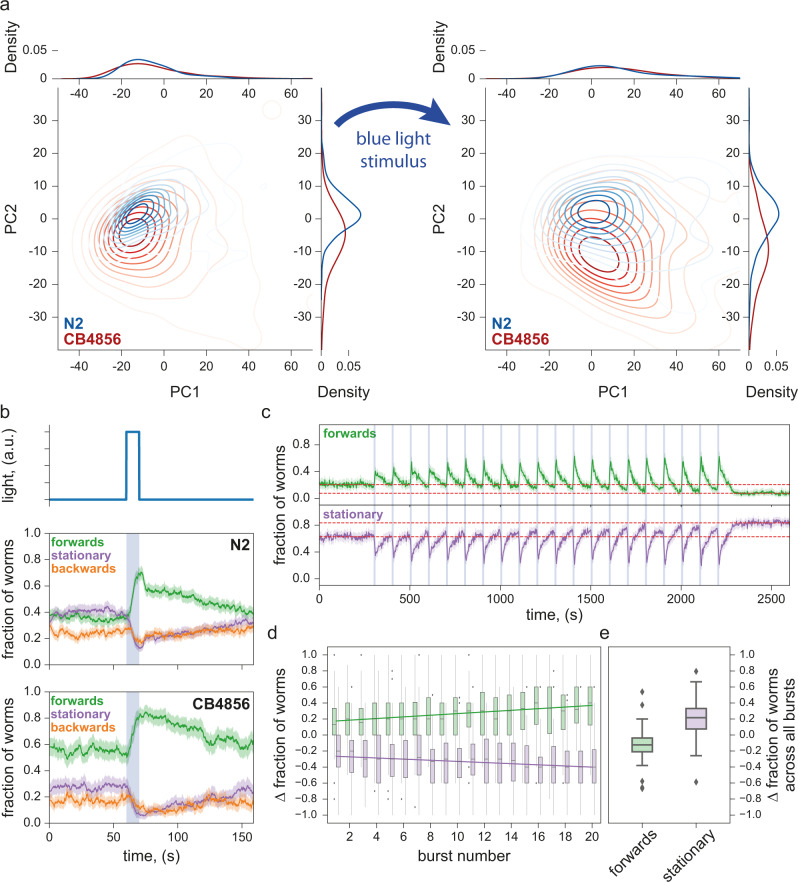
Fig. 3. Escape response to photostimulation.
a PCA plots of N2 and CB4856 in the 10 sec immediately before (left) and immediately after (right) a 10 s stimulus showing detectable behavioural responses: both strains moved to new, better separated positions in the phenotype space as a result of stimulation. Sample size (in wells, two worms per well) is NN2 = 377, NCB4856 = 115 (left), NN2 = 398, NCB4856 = 98 (right) b Photostimulation with blue light elicited similar escape responses in both N2 and CB4856 strains, with the fraction of worms moving forwards increasing during the stimulus and decreasing after the stimulus. However, post-stimulus recovery appears to occur at two timescales for N2 but not for CB4856. Solid lines are means, shaded areas show the 95% confidence interval. Sample size (in wells, two worms per well) is NN2 = 529, NCB4856 = 396. c Repeated photostimulation triggered increasing aversive response in N2, also leaving a higher fraction of worms stationary after serial stimulation than before (vertical separation between the two dashed lines to contrast the before and the after levels). N = 144 wells (three worms per well). d The fraction of worms triggered to move forwards by each stimulus increased throughout the stimulation series, as a decreasing fraction of worms remained stationary across each successive photostimulus. Each data point was obtained by taking the difference in a 10 s window just before and just after the end of each stimulus. N = 144 wells (3 worms per well). e After repeated photostimulation, a larger fraction of the population than before was stationary. This was quantified by taking the difference of the population fractions in each motion mode between the final 5 min and the initial 5 min of the experiment (red dashed lines in c). Each box shows median, 25th and 75th percentile (central mark, lower and upper edge, respectively), while whiskers show the rest of the distribution except for outliers (outside 1.5 times the IQR above the 75th and below the 25th percentile), plotted individually. N = 144 wells (three worms per well).

