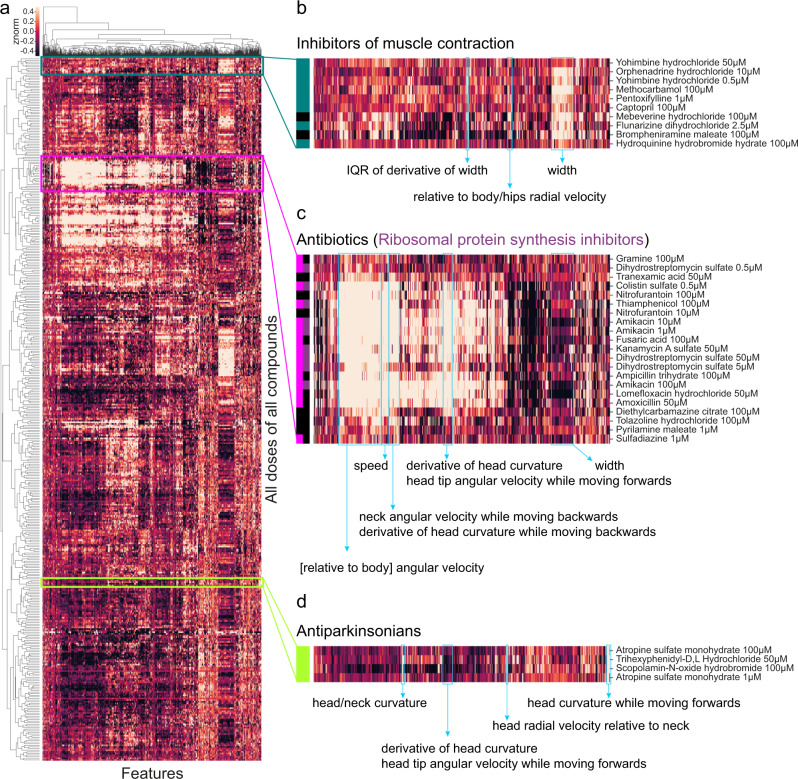
Fig. 5. Worms respond differently to drugs with different modes of action.
a Heatmap of behavioural fingerprints of worms in response to treatment with drugs. Each row is the average phenotype of worms across multiple wells treated with the same compound at the same dose. Each column is a single behavioural feature. The colour indicates the z-normalised feature value. b–d Some compounds from the same class cluster together according to their behavioural response including inhibitors of muscle contraction (b), antibiotics (c), and antiparkinsonian (anticholinergic) drugs (d).

