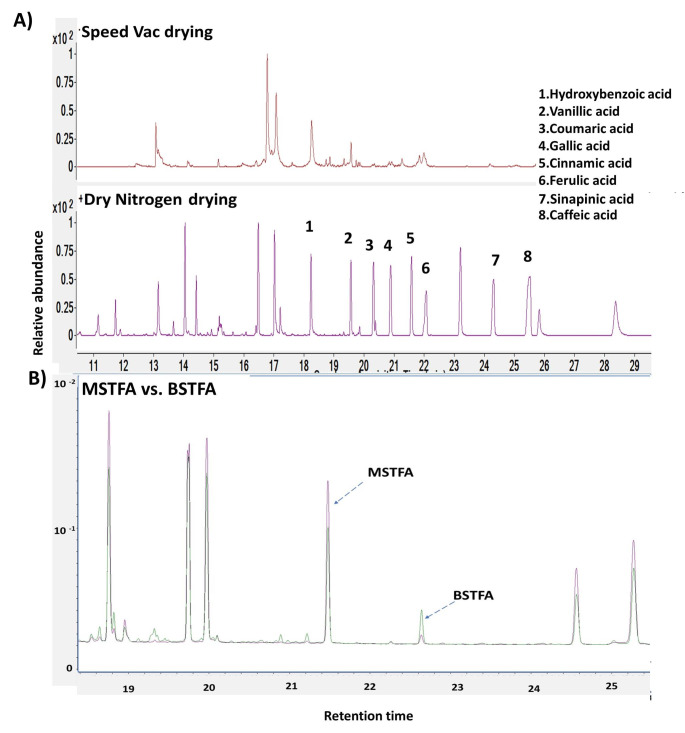
Fig. 4.
Optimization of comparative drying and derivatization methodology for phenolics detection. A) Dry N2 purging technique showed higher recoveries of (1) Hydroxybenzoic acid, (2) Vanillic acid, (3) Coumaric acid, (4) Gallic acid (5) Cinnamic acid, (6) Ferulic acid (7) Sinapinic acid and (8) Caffeic acid. B) GC-MS chromatogram showed that MSTFA derivatization has relatively higher peak abundances of phenolics than BSTFA. The violet spectrum lines represent MSTFA derivatized and the green spectrum lines represents BSTFA derivatized phenolics. The X-axis showed retention times and the Y-axis showed relative peak abundances

