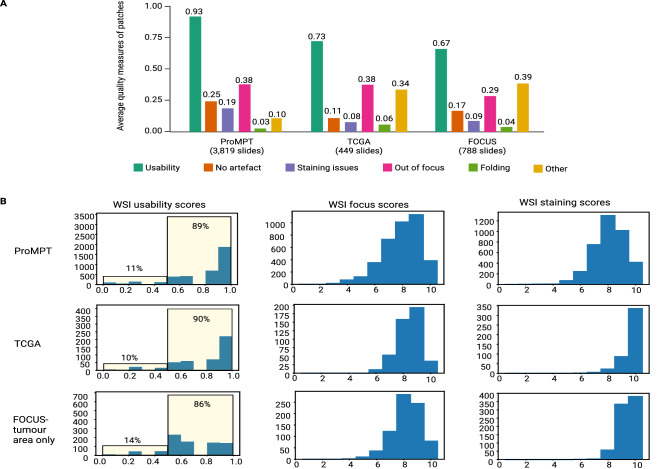
Figure 1.
(A) Average estimated quality measures of patches extracted from the entire ProMPT cohort (3819 WSIs), and the TCGA-prostate (449 WSIs), and FOCUS (788 WSIs) cohorts. (B) Distribution of estimated usability scores of WSIs in each cohort (entire ProMPT cohort, TCGA, and FOCUS) and distribution of estimated scores for WSI focus and H&E staining quality (0–10, lowest quality to highest quality). WSI scores for the FOCUS cohort are calculated for tumour regions only.

