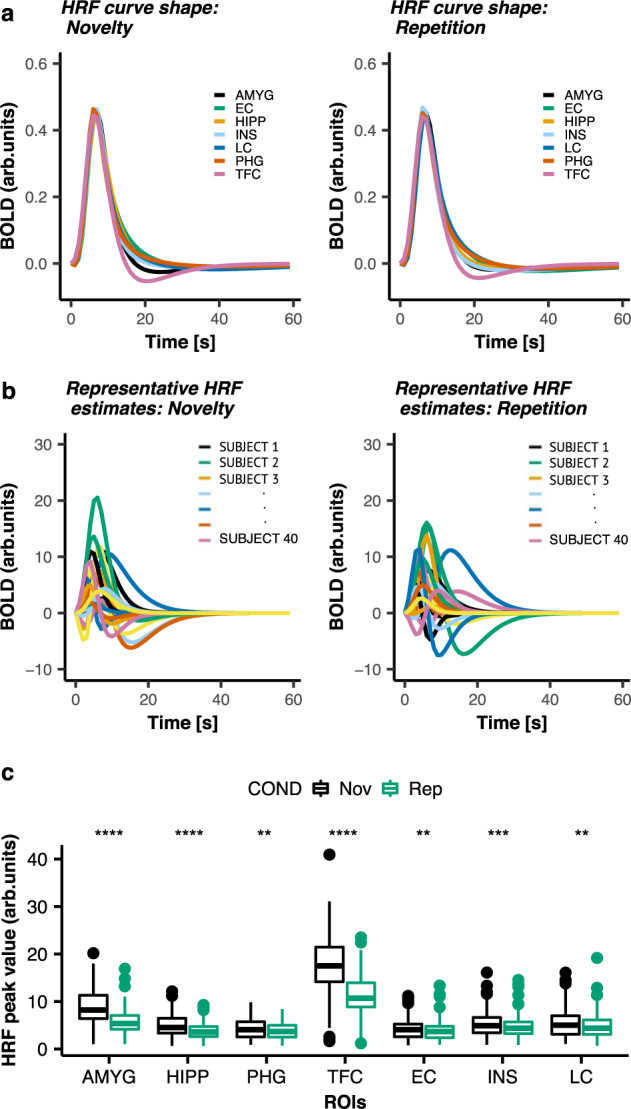
Fig. 2. Regional variability of the hemodynamic response function.

a Group HRF curve shapes obtained within ROIs during Novelty (left panel) or Repetition (right panel). b Representative subject-specific HRF estimates obtained for the LC during Novelty (left panel) and Repetition (right panel) for 40 representative participants (each color represents a different, randomly chosen participant). The x-axis is the time [seconds]. The y-axis is the BOLD signal intensity [arb. units]. c Statistical comparisons of the averaged HRF amplitude (HRF peak values) across runs obtained within ROIs during NvR (number of participants n = 128). On a group level the HRF curve shapes exhibited similar dynamics (peak latency and width (FWHM of the peak)) between the two experimental conditions. However, the HRF amplitude was significantly larger during Novelty compared to Repetition. ** p < 0.01; *** p < 0.001; **** p < 0.0001 (uncorrected); two-tailed paired t-test. Horizontal lines within boxes indicate the median. The bottom and top part of the boxes indicate the 25th and 75th percentile of the underlying HRF amplitude distribution, respectively. Dots represent outliers. Detailed statistics are provided in Supplementary Table 3 in the Supplementary material. Abbreviations: AMYG amygdala, COND condition, EC entorhinal cortex, HiPP hippocampus, INS insula, LC locus coeruleus, Nov novelty, PHG parahippocampal gyrus, Rep repetition, TFC temporal fusiform cortex.
