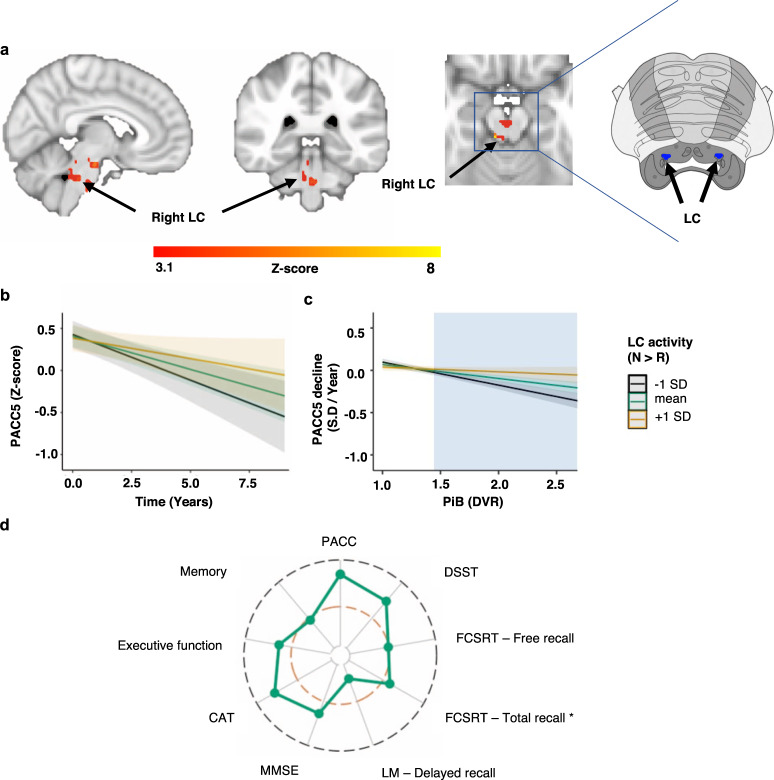
Fig. 5. Lower novelty-related LC activity is associated with steeper Aβ-related PACC5 decline.
a Voxel-wise analyses relating NvR activity, PiB and longitudinal PACC5 measurements: lower NvR activation in the right LC and right parahippocampal gyrus are associated with greater decline on the PACC5 when PiB is elevated. Inference was performed using mixed-effects models including PACC5 as outcome variable, NvR contrast estimates, time, PiB, their interactions, age, sex and years of education as fixed effects, random intercepts for participants and slopes for time (number of years between baseline and follow-up cognitive assessments). Brain activation maps were corrected for multiple comparisons using cluster-extent-based thresholding (number of participants n = 128 and number of observations is 753; cluster defining threshold Z > 3.1, two-tailed p < 0.05, FWER-corrected). The insert on the right side shows the corresponding slice of the brainstem from the Duvernoy’s atlas (adapted by permission from Springer Nature: Springer Science & Business Media)93. The LC is indicated with red markers. b, c Associations between PACC5 over time and LC activity during NvR. b Visualization of the two-way interaction between LC activity and time (number of participants n = 128 and number of observations is 753). c Visualization of the interaction between LC NvR activity and PiB on PACC5 slopes (number of participants n = 128). The cyan box illustrates the range of PiB values at which NvR LC activity is associated with PACC5 decline. In all line plots, the estimated marginal mean of the interaction terms is plotted at the mean (green), +1 SD (yellow) and −1 SD (black), but analyses were done continuously. Inference was performed using linear regression including PACC5 decline as outcome variable, and NvR LC activity, PiB, their interaction, age, sex, and years of education as predictor variables. Shaded areas around the fit lines show 95% CI. d Radar chart showing the magnitude of the associations (estimate/standard error) between LC NvR activity and PiB-related cognitive decline on the subtests of the PACC5, as well as the executive function and memory composite scores (number of participants n = 128 and number of observations is 753). The inner orange line indicated t-value = 1.96. The outer black line indicated t-value = 4.00. More detailed results are provided in Supplementary Table 5. * Random effects were modeled using only a random intercept for each subject. Abbreviations: CAT Category Fluency Test, DSST Digit-Symbol Substitution Test, DVR Distribution volume ratio, FCSRT Free and Cued Selective Reminder Test, LC locus coeruleus, LM Logical Memory, MMSE Mini-Mental State Examination, PiB Pittsburgh Compound-B, PACC5 Preclinical Alzheimer Cognitive Composite, SD standard deviation.

