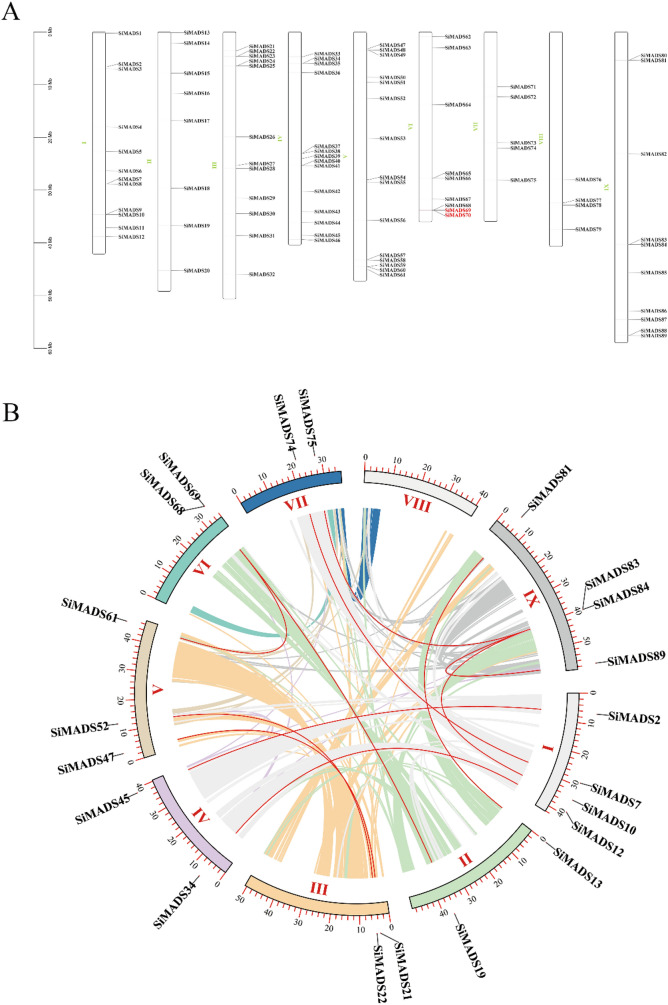
Figure 4.
The chromosomal distribution and synteny blocks of the S. italica MADS-box genes. (A). Schematic representation of the chromosomal distribution of the S. italica MADS-box genes. Vertical bars represent the chromosomes of S. italica. The chromosome number is indicated to the left of each chromosome. The scale on the left represents chromosome length. (B). Schematic representation of the chromosomal distribution and interchromosomal relationships of S. italica MADS-box genes. Colored lines indicate all synteny blocks in the S. italica genome and red lines indicate duplicated MADS-box gene pairs. Chromosome number is indicated at the bottom of each chromosome.

