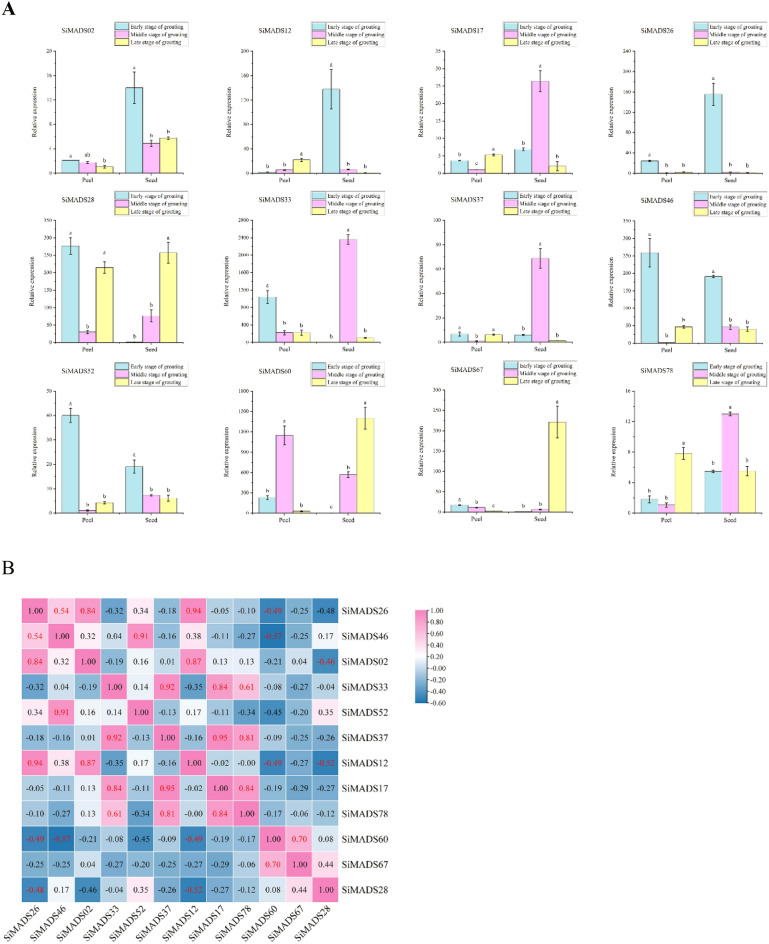
Figure 8.
Expression pattern and correlation of 12 S. italica MADS-box genes during fruit development. (A) qRT-PCR was used to detect the expression patterns of 12 S. italica MADS-box genes in peel and fruit before, during and after grain filling. Error bars were obtained from three measurements. Lowercase letter above the bar indicates significant difference (α = 0.05, LSD) among treatments. (B) Positive number: positively correlated; negative number: negatively correlated. Red numbers indicate a significant correlation at the 0.05 level.

