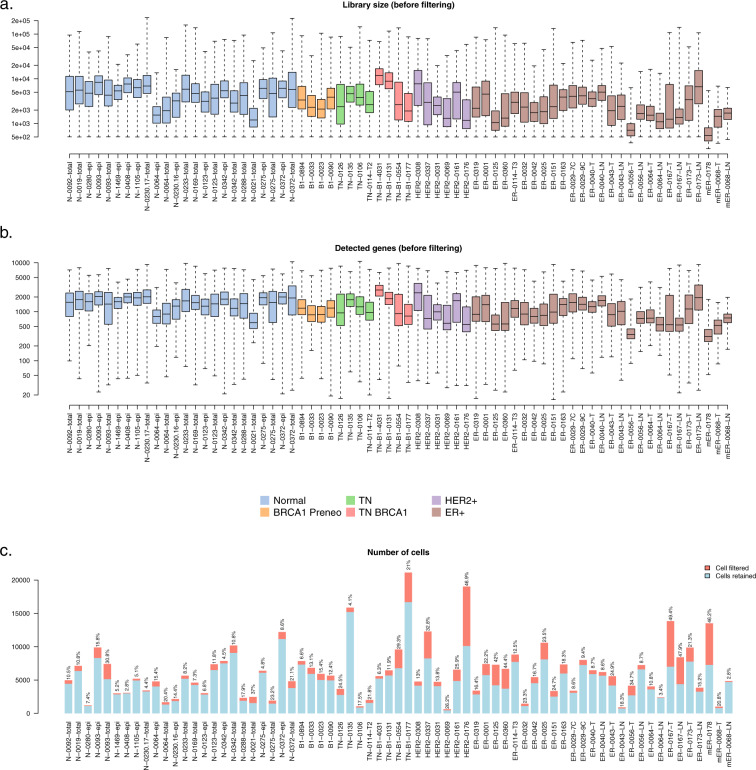
Fig. 2.
Quality control and cell filtering. Box plots of (a) the library sizes and (b) the numbers of detected genes for all the cells in each of the 69 samples before filtering. Boxes show median and quartiles and whiskers show minimum and maximum. Boxes are colored by tumor type. (c) Number of cells in each of the 69 samples. Blue segments show the number of cells that are kept after the cell filtering while red segments show filtered cells. The proportion of filtered cells is labelled on top of each bar.

