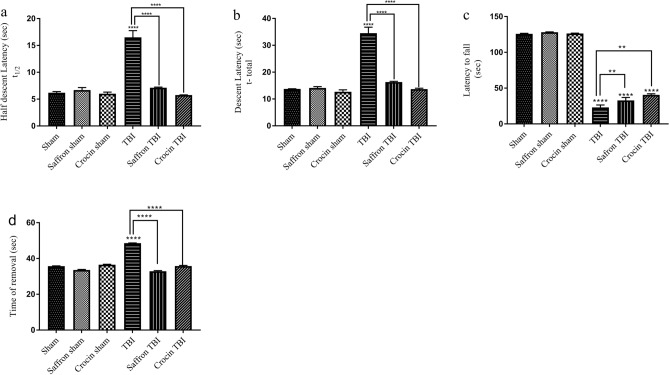
Figure 4.
Pole climb, rotarod, and adhesive tests results. (a, b) show t1/2 and t values respectively in pole climb test results. Data is mean ± SEM of eight mice per group. (****) represents p < 0.0001. (c) The latency to fall from the rotarod in (s). The latency was analyzed for all experimental groups. Data is mean ± SD of eight mice per group. (**) and (****) represent p < 0.0021 and < 0.0001 respectively. (d) The latency to remove the tape in adhesive test for all experimental groups. Data are mean ± SEM of eight animals in each group. (****) represents p < 0.0001.

